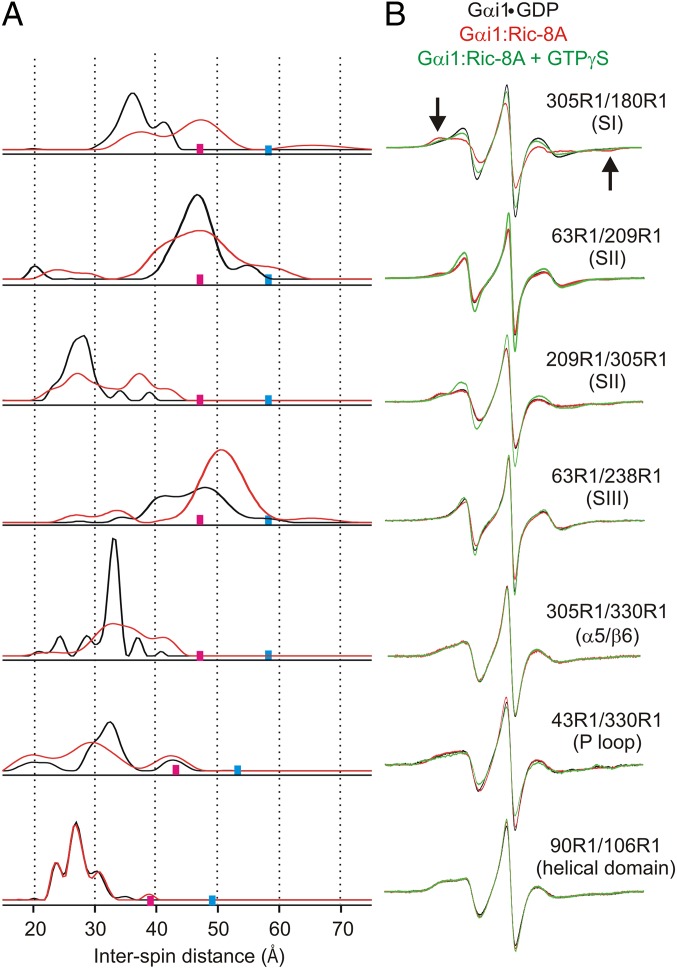
Fig. 3.
Distance distributions for spin pairs within the Ras-like domain in Gαi1•GDP and the corresponding Gαi1:Ric-8A complex. (A) Distance distributions for the indicated pairs are shown for Gαi1•GDP (black traces) and for the complex with Ric-8A (red traces). Upper limits for reliable distance and width determination are shown as cyan and magenta bars, respectively, on the distance axis. (B) CW EPR spectra for the corresponding doubly labeled proteins in the Gαi1•GDP (black), Gαi1:Ric-8A complex (red), and after the addition of GTPγS (green).

