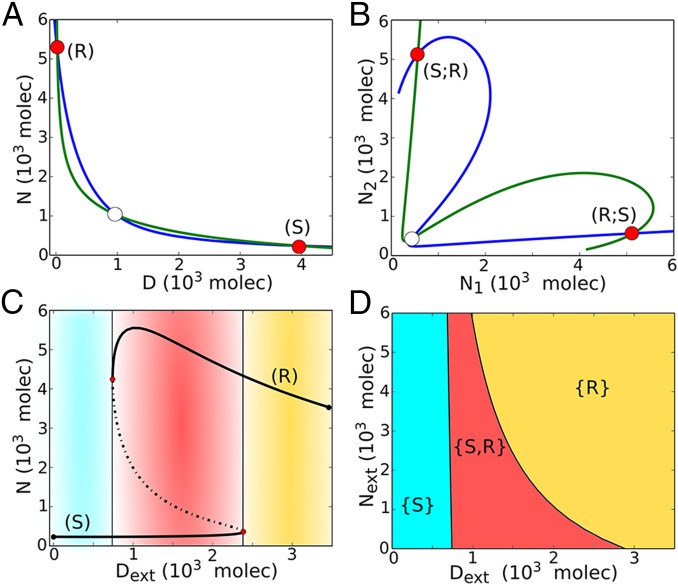
Fig. 3.
Dynamical system characteristics of the Notch–Delta circuit. (A) Nullclines for the case of one cell interacting with fixed values of external proteins (, ). The blue nullcline is for condition and , and the green nullcline is for condition and (Eqs. 5–7). Unfilled circles represent unstable steady states, whereas red filled circles represent the two stable states–– the Sender (S) and the Receiver (R). (B) Nullclines for the case of two cells interacting with each other through Notch–Delta. The blue nullcline is for condition of all ODEs being set to zero except for and the green nullcline is for condition of all ODEs being set to zero except for (Eqs. S19–S21). Unfilled circle represents unstable steady states, and the red filled circles represent the two stable states––(S; R) and (R; S). (C) Bifurcation, for the one-cell case, of Notch protein levels on the membrane as a function of the number of external Delta for fixed molecules. Starting in the Sender (S) state, i.e., (low Notch, high Delta) (blue region) and increasing the external Delta at some threshold the cell undergoes a transition to the Receiver state, i.e., (high Notch, low Delta) (yellow region). The reverse transition occurs at a different number of proteins that leads to a region of coexistence of both states––Sender and Receiver (red region). Solid curves represent stable steady states, whereas dotted curves represent unstable steady states. (D) Phenotype diagram as a function of external Notch and external Delta for one-cell model. The monostable phase {S} corresponds to the Sender state (low Notch, high Delta) and monostable phase {R} corresponds to the Receiver state (high Notch, low Delta). The bistable phase {S,R} corresponds to a region of coexistence of both states––Sender and Receiver.

