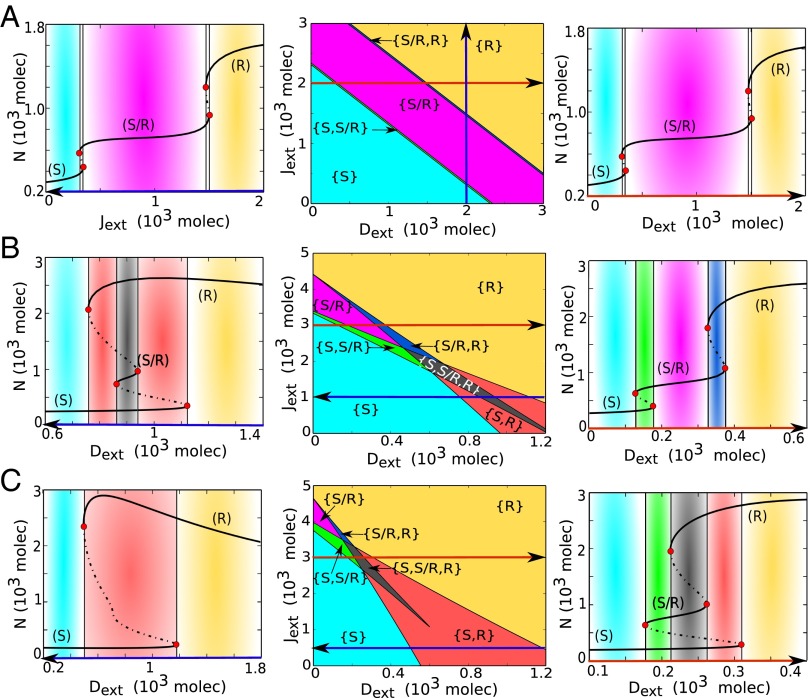
Fig. 5.
Phenotype diagram and bifurcation curves for the one-cell Notch–Delta–Jagged–Fringe circuit. The phenotype diagram shows the different possible phases when the circuit is driven by variable levels of both external Jagged and external Delta. (A) Phenotype diagram (Center) for (no Fringe effect). In this case, the circuit response to external Jagged and external Delta is symmetric. Bifurcation curve of Notch protein levels with respect to varying external Jagged values (Left) for fixed and molecules and (Right) bifurcation curve with respect to varying external Delta values for fixed and molecules. (B) Phenotype diagram (Center) for and (intermediate effect of Fringe). Bifurcation curves of Notch protein levels in response to varying for and molecules (Left), i.e., Notch signaling mainly mediated through Delta and for fixed and molecules (Right), i.e., Notch signaling mainly mediated through Jagged. (C) Phenotype diagram (Center) for and (very strong effect of Fringe). Bifurcation curves of Notch protein levels in response to for fixed and molecules (Left), in which the hybrid S/R state no longer exists, and the circuit behaves like a bistable toggle switch similar to the circuit considering Notch–Delta only, and for fixed and molecules (Right), in which the hybrid S/R state can be observed to coexist with other states (green and gray regions). Phenotype diagrams for are presented in Fig. S7.

