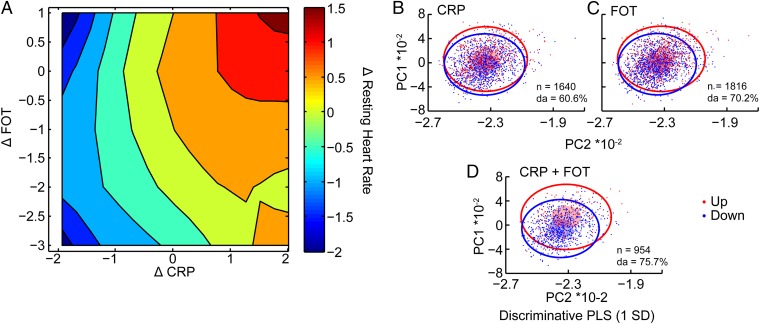
Fig. 3.
FOT–CRP interactions affect pulse changes. (A) Coelevated FOT and CRP strongly correlate with pulse increases. Triple association of FOT, inflammation, and annual pulse change presents the differences between the observed and expected value for individuals with the same age, sex, and BMI. Annual pulse changes (color code) were square root transformed. Note the increasing tendency for elevated pulse (red) in those participants with coincreased FOT and CRP. (B–D) CRP and FOT changes coclassify volunteers with pulse variations. Volunteers with elevated or decreased pulse (1 SD) were classified by CRP (B), FOT (C), or CRP and FOT (D). Small translucent ellipsoids represent 0.5 × SD and outer circles 3 × SD for each group. To illustrate the true (eight-dimensional) separation between volunteers we present the discrimination ability (DA) with closer values to their own group mean than to the other group.

