Fig. 3.
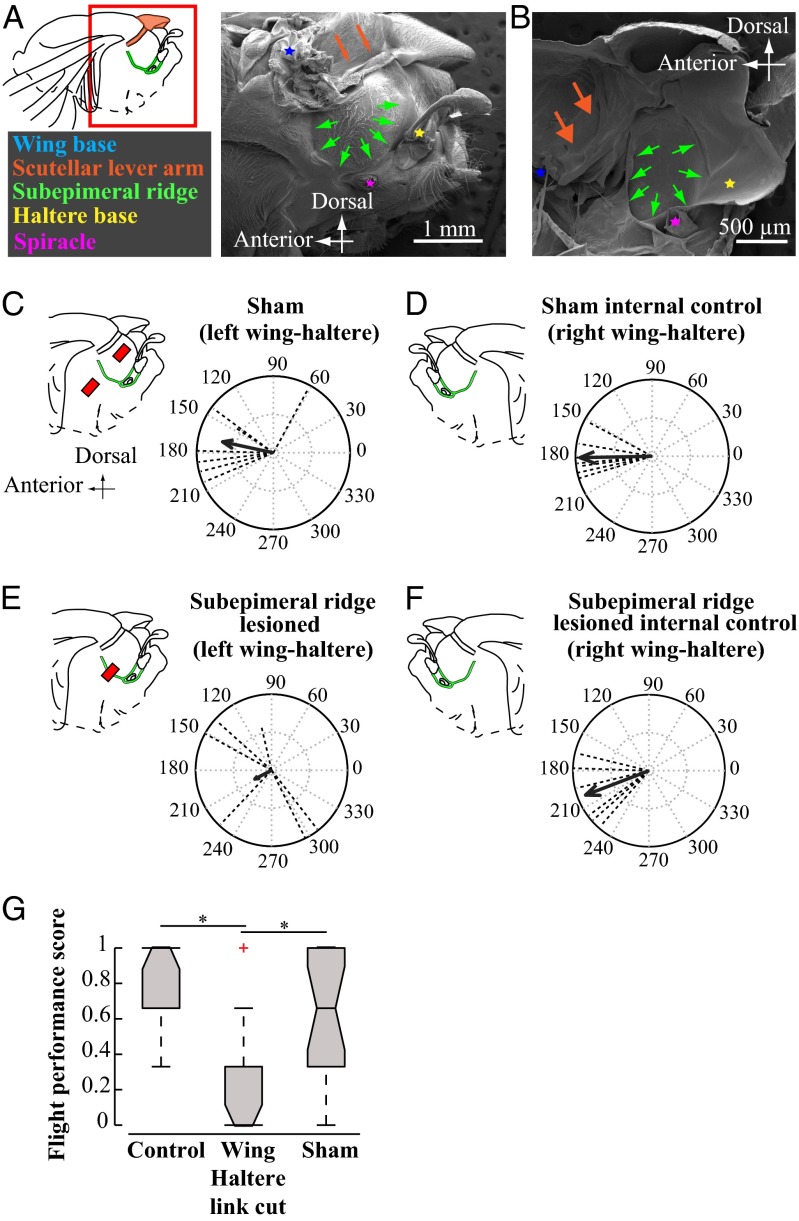
Each wing–haltere pair is coordinated via a separate mechanical linkage running through the subepimeral ridge. (A, Inset) Red box around the fly wing base highlights the approximate region of the thorax imaged using a SEM. (A and B) SEM images of H. illucens thorax with wing (blue asterisk) and haltere (yellow asterisk) base, scutellar lever arm (brown arrows), epimeral ridge (green arrows), and spiracle (purple asterisk) in lateral (A) and hemisectional (B) views. (C–F) Phase relationships between ipsilateral wing–haltere pair. (C–F, Left) Lateral thorax with red bar indicating lesioned area relative to the supepimeral ridge (green). All treatments were performed on the left side, leaving the right intact as an internal control. (C) In sham-treated flies, the left wing–haltere pair, which is perforated above and below the ridge, continues to move antiphase to each other (ϕ = 167.84°; r = 0.6780; n = 7; P < 0.01; Moore’s test), similar to D, the right side untreated wing–haltere pair that acts as internal control (ϕ = 181.14°; r = 0.9420; P < 0.001, n = 7). (E) Lesioning the subepimeral ridge disrupts antiphase coordination in left wing–haltere pair (ϕ = 207.72°, r = 0.2485, n = 6, P > 0.5), whereas (F) the unlesioned wing–haltere pair on the right side, which acts as internal control, maintains antiphase coordination (ϕ = 201.05°; r = 0.8938, P < 0.005; n = 6). (G) Lesioning the subepimeral ridge and disrupting wing–haltere coordination on both sides impairs flight. We measured flight performance (shown as notched box plots) using the drop test [SI Materials and Methods, Free Flight (Drop Test) Assay for Flies with Severed Subepimeral Ridge; n = 20 per treatment], which measured the ability of each fly to recover from free fall in a vertical cylinder in three separate trials. Flies scored 0 if did not recover flight in all three trials, or 1/3, 2/3, or 1 if it recovered flight, respectively, in one, two, or three of three trials. Significant differences in groups (P < 0.001, asterisk) were identified using nonparametric Kruskal–Wallis ANOVA, followed by the Tukey–Kramer post hoc multicomparison analysis.

