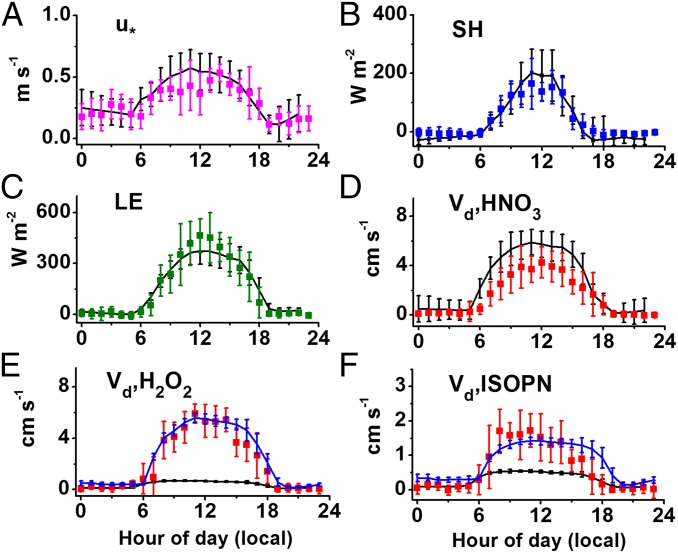
Fig. 6.
Base GEOS−Chem (run at 0.25° lat × 0.33° lon) simulations (black lines) and observations (colored points) for June 2013 at the Brent, AL CTR site. The modeled (A) friction velocity, (B) sensible heat flux, and (C) latent heat flux data are derived from GEOS-FP hourly-resolved meteorology. Deposition velocities (D–F) were calculated from GEOS−Chem without modifications (black lines) or with adjustments to the Henry’s coefficient of these compounds (blue lines, if applicable) for a sensitivity study (see text). Simulations were performed for all 30 d in June 2013, and observed data were measured for the 5 d included in this study. Error bars represent 1 SD from mean values.

