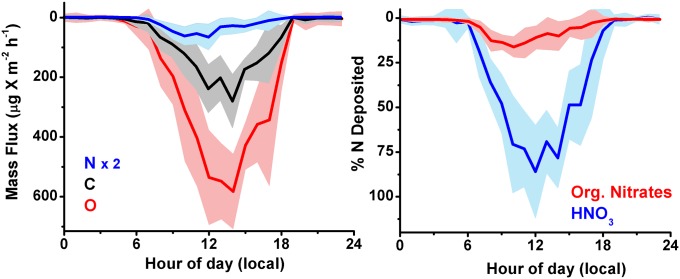
Fig. 8.
(Left) Net carbon, oxygen, and nitrogen downward flux by mass, calculated from molecular formulas for compounds shown in SI Appendix, Table S1, and averaged over the dates in the study. (Right) Percent contribution of organic nitrates and nitric acid to the measured oxidized nitrogen flux.

