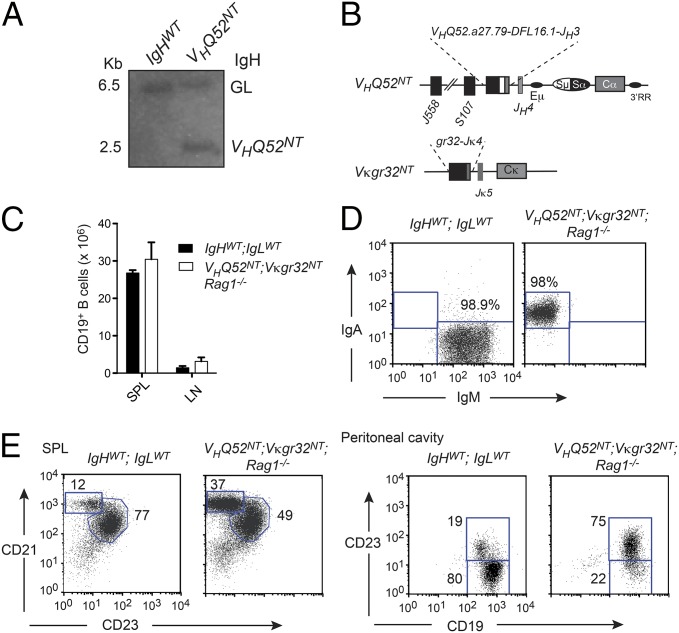
Fig. 1.
B-cell development in VHQ52NT; Vκgr32NT monoclonal mice. (A) IgH Southern blotting analysis of wild-type and VHQ52NT HT mice. Bands corresponding to IgH germ line (GL) and VHQ52NT alleles are indicated. (B) Structure of rearranged IgH and Igκ loci in IgA transnuclear mice. (C) Numbers of CD19+ B cells in SP and inguinal LNs of control (IgHWT;IgLWT) and IgA monoclonal mice (VHQ52NT; Vκgr32NT; Rag1−/−), determined by flow cytometric analysis. (D) Representative flow cytometric analysis of splenic CD19+-gated B cells in control (n = 2) and IgA monoclonal mice (n = 2). (E) Representative flow cytometric analysis of splenic CD19+ B cells in controls and IgA monoclonal mice (n = 2). Peritoneal cavity B cells were analyzed after gating, respectively, on IgM+ (IgHWT;IgLWT) or IgA+ (VHQ52NT; Vκgr32NT; Rag1−/−) cells (n = 2). Numbers indicate percentage of boxed B-cell subsets.

