Fig. 3.
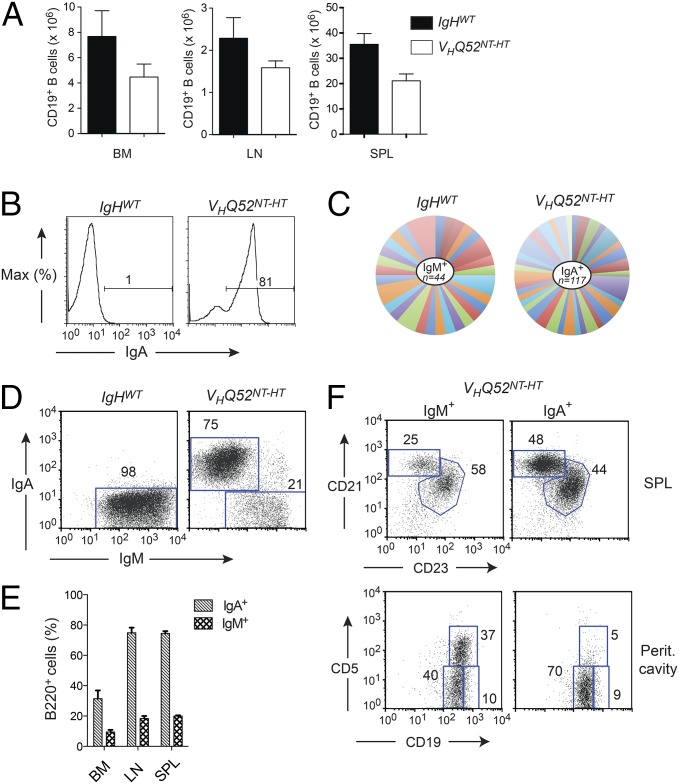
A substantial number of B cells lose sIgA expression in VHQ52NT mice. (A) Absolute number of CD19+ B cells in BM, inguinal LNs and SP of controls (n = 6), and VHQ52NT HT (n = 7) mice. (B) Frequency of splenic CD19+-gated sIgA+ B cells in representative VHQ52NT-HT HT animals and littermate controls, as determined by flow cytometric analysis. Numbers indicate percentage of sIgA+ B cells. (C) Pie chart representation of Vκ gene rearrangement analysis obtained from splenic IgM+ B cells of controls (n = 2) and IgA+ B cells of VHQ52NT-HT mice (n = 6). Each colored segment represents a unique rearrangement. Segment size defines frequency of individual Vκ rearrangements. (D) Representative flow cytometric analysis of SP B cells in controls (n = 6) and VHQ52NT-HT mice (n = 7) stained for sIgM and sIgA, respectively. Numbers indicate frequencies of CD19+-gated boxed B cells. (E) Frequency of sIgM+ and sIgA+ cells among B220+ B cells in lymphoid organs of VHQ52NT-HT mice (n = 7). (F) Representative flow cytometric analysis of cell suspensions from SP and peritoneal cavity lavages of VHQ52NT-HT mice, gating, respectively, on sIgM+ and sIgA+ B cells. Numbers indicate frequency of boxed B-cell subsets.

