
Fig. 5.
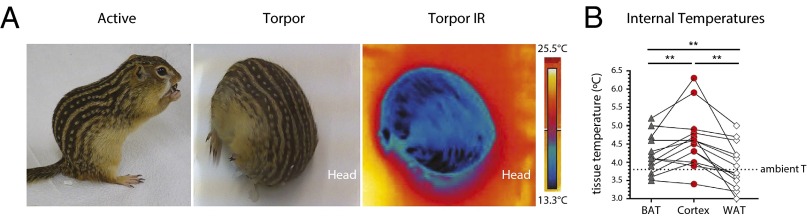
Brain temperature is elevated in torpid hibernating squirrels. (A) Photographs of active and torpid thirteen-lined ground squirrel, and infrared image of torpid squirrel. Infrared photos were taken at room temperature to highlight the difference and increase contrast between ambient temperature and that of the surface of a torpid squirrel moved from the hibernaculum. Scale represents minimum and maximum temperature. (B) Internal temperatures of cortex, BAT, and WAT in torpid squirrels. Lines connecting symbols denote temperature profiles of individual animals. Horizontal line denotes ambient temperature of the hibernaculum (n = 14 animals; mean ± SEM; ANOVA with Holm-Sidak’s multiple comparisons test; **P < 0.01). IR, infrared.