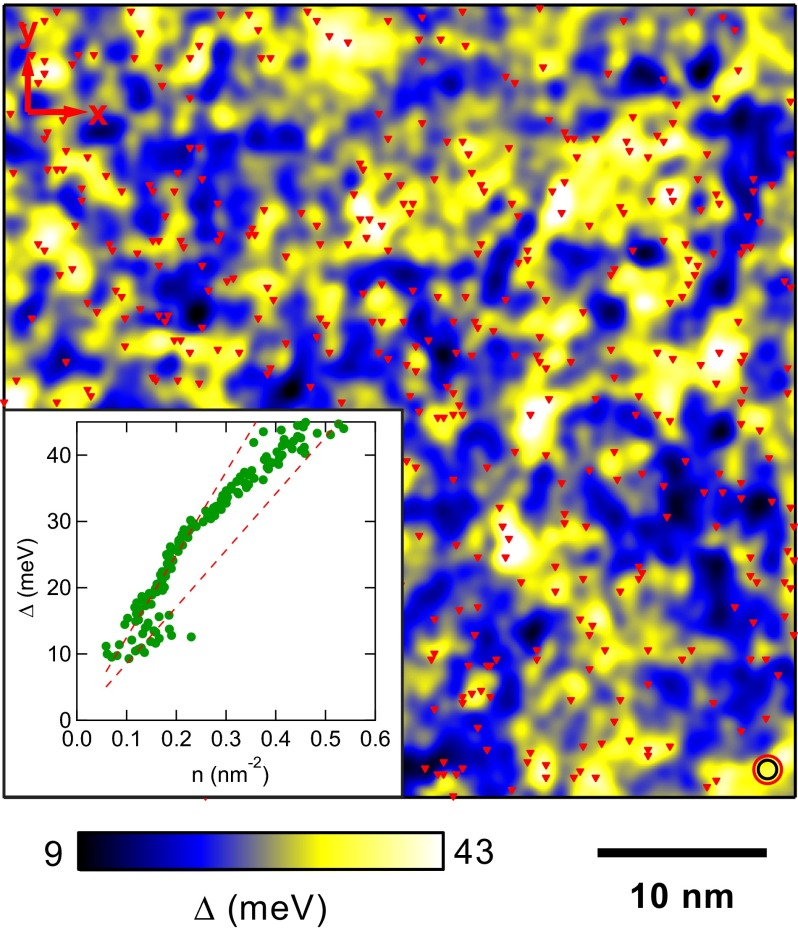
Fig. 4.
Atomic-scale measurements of interaction strength of surface states with magnetic dopant atoms. Shown above is a measured Dirac-mass gap map with Gaussian smoothing length ζ, overlaid with Cr locations measured from Fig. 1A (red triangles). Cr atoms are observed to be positioned with high probability in the larger gap areas (yellow), but rarely in the smaller gap areas (blue). The other fainter features in topography (white) are shown not to occur at Bi/Sb substitutional sites, so we do not assign them as magnetic dopant atoms. Red and black circles on the right bottom corner indicate the correlation radii ξ = 0.82 nm and ζ = 0.55 nm, respectively. (Inset) Each data point represents the average value of Dirac mass gap over all of the regions having the same value of Cr density n. The resulting slope of best linear fit yields J* = 145 meV·nm2. This is to our knowledge the first atomic-scale measurement of the interaction strength of surface states with magnetic dopant atoms in a ferromagnetic TI. The uncertainty represented by two dashed lines is not statistical but comes from the systematic uncertainty in magnitude of Sz, which we take to be 20%.

