
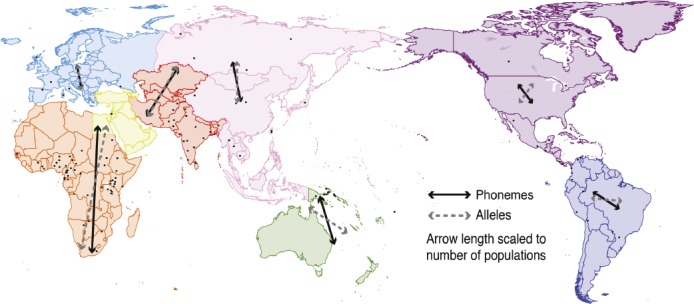
For the Ruhlen phoneme–genome dataset, pairwise geographic distance matrices projected along different axes; within each region, the rotated axis of geographic distance most strongly associated with phonemic distance (black arrows) and genetic distance (gray dashed arrows) is shown.