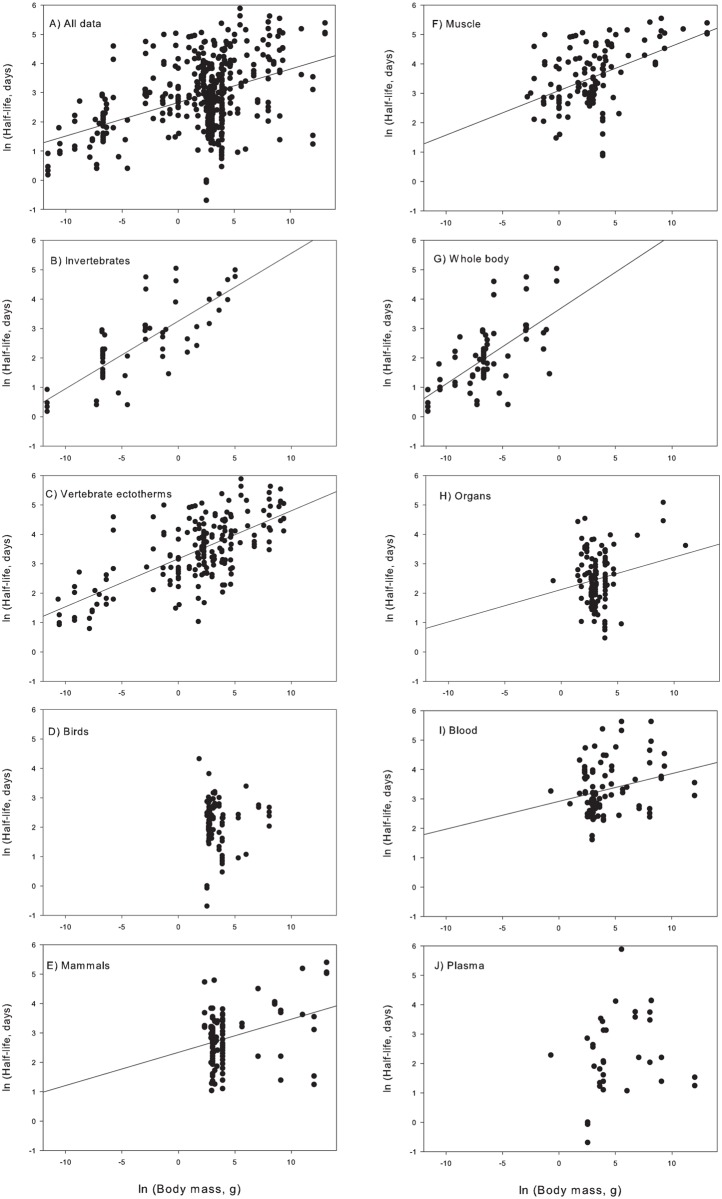
Fig 2. Relationships between ln(animal body mass, grams) and ln(isotopic half-life, days).
A) Plot for all tissue types and taxonomic groups combined. B–E) Plotted separately for each taxon. F–J) Plotted separately for each tissue type. Regression information for each tissue type and taxa are presented in Table 1.

