
Figure 3.
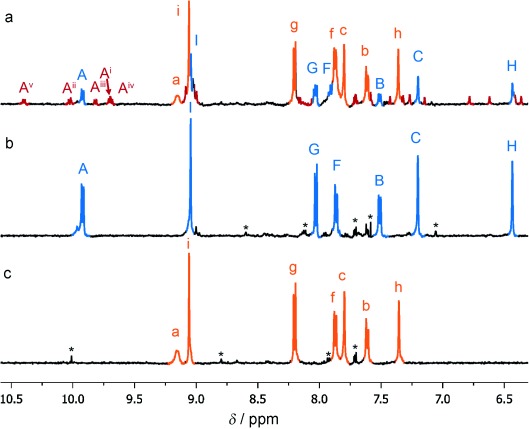
1H NMR spectra (500 MHz, CD3CN, 298 K). a) The mixture of Solomon link 7 (orange), pentafoil knot 8 (blue), mixed pentafoil knots 9 (red), and 10 (too small an amount to be visible by 1H NMR spectroscopy but observed using ESIMS; see Figure S10 in the Supporting Information) obtained by reaction of diamine 6 with dialdehydes 1 and 2. Products formed using only one dialdehyde: b) pentafoil knot 8 (from 2) and c) Solomon link 7 (from 1) prior to purification. The * marks small signals corresponding to aldehyde-containing ligand strands (products of imine hydrolysis) in (b) and (c).