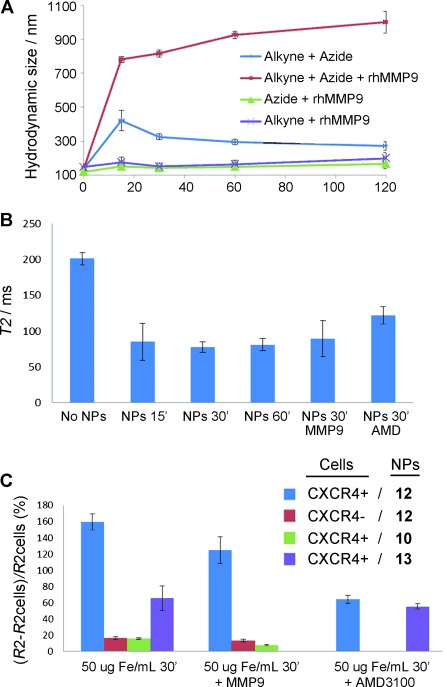
Figure 4.

A) Hydrodynamic size measurements. Blue=1:1 mixture of alkyne and azide NPs. Red=1:1 mixture of the alkyne and azide NPs in the presence of hrMMP9. Purple=alkyne NPs in the presence of hrMMP9. Green=azide NPs in the presence of hrMMP9. B) T2 values obtained from U87.CD4.CXCR4 cells embedded in 1 % agarose gels incubated with a 1:1 mixture of the NPs (50 μg Fe/mL) for different time periods (15, 30, and 60 min), either alone or in the presence exogenous MMP9 or the CXCR4 inhibitor AMD3100 (30 min). C) ΔR2/R2 cell values obtained from either U87.CD4.CXCR4 (CXCR4+) or U87.CD4 (CXCR4-) cells incubated with a 1:1 mixture of the NPs (50 μg Fe/mL; either final probe or controls, see Figure 3) for 30 min. The results are given as the mean of three independent experiments ± the standard deviation.
