
Fig 4.
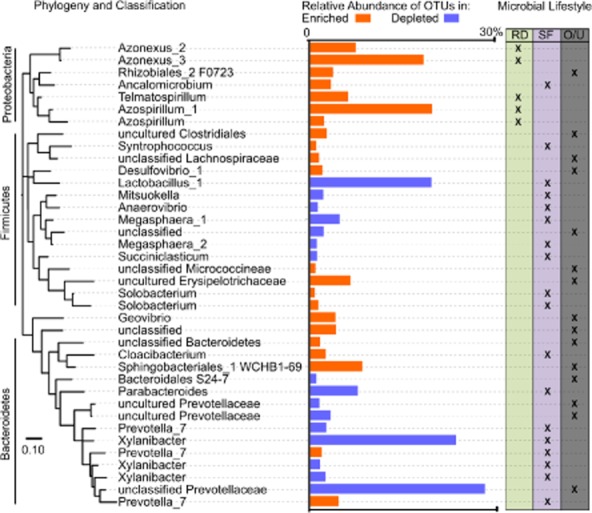
Phylogenetic tree and sequence abundance of depleted and enriched OTUs. Enriched OTUs (orange) and depleted OTUs (blue) show clustering by phylogeny and have differential metabolic roles when classified by rhizospheric diazotroph (RD, pea green), saccharolytic fermenter (SF, light purple) and other/unclassified (O/U, grey). References for metabolic assignment and phylogenetic tree bootstrap values in Supporting Information Fig. S6.