
Fig 4.
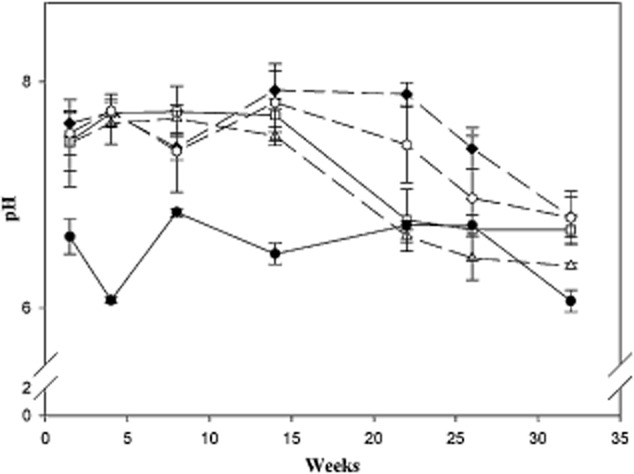
pH measurements performed along the study during 8 months, on pristine soil (P) (filled circle), burnt bulk soil (C) (filled diamond), bioremediation (B) (triangle) and rhizoremediation (R) (square), and plants control (CP) (hexagon). Data are shown as mean (n = 3) and error bars refer to standard deviations.