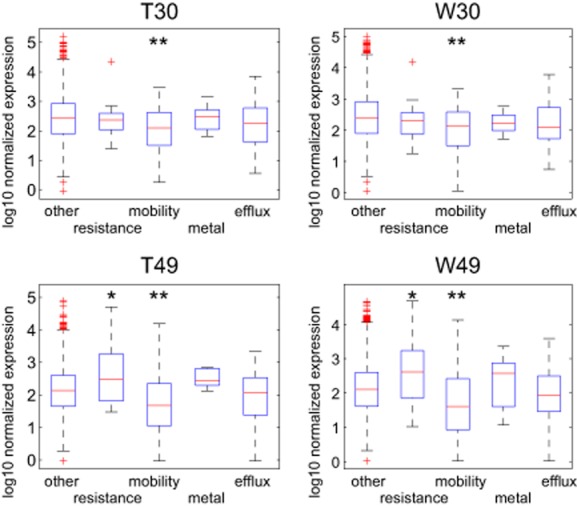
Figure 4.

Expression of specific genes in strain PA30 and PA49 in different water matrices. Absolute gene expression values are depicted as box plots for the different samples of strain PA30 and PA49 cultivated in tap water (T) and waste water (W). Genes were manually selected by their functional classification as resistance (associated with modification and deactivation of antibiotics), mobility (associated with horizontal gene transfer and recombination), metal (associated with heavy metal tolerance), efflux (associated with multi-drug efflux pumps) or other (not included in any other class). Asterisks indicate a significant difference in the medians of the particular gene class and the other genes determined with the Mann–Whitney–Wilcoxon test (*P < 0.05; **P < 0.001).
