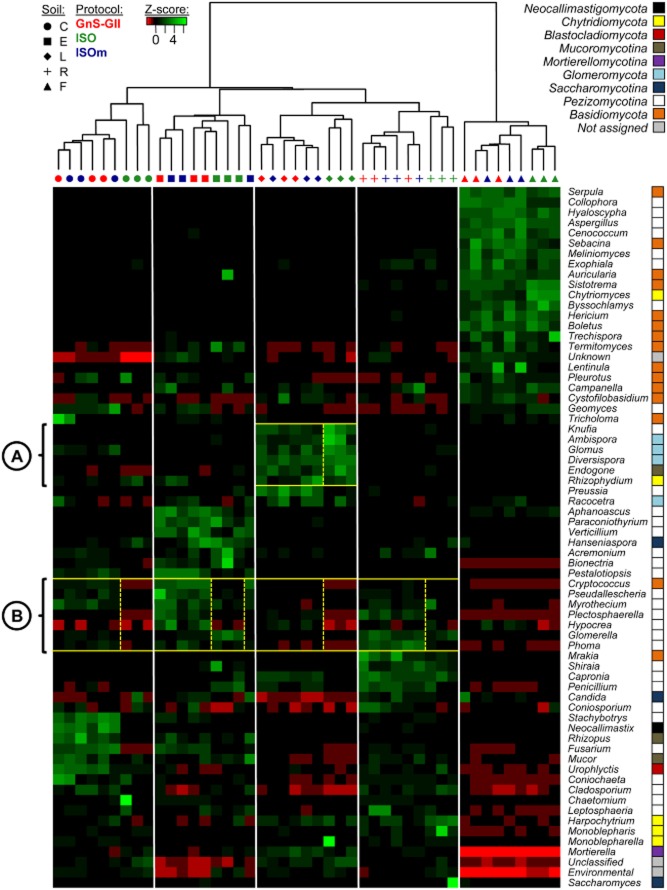
Fig 2.
Heat map comparison of the dominant fungal genera detected in soils according to extraction procedures. The five different soils (C, E, F, L, R) were organized based on the UPGMA dendrogram of unifrac distances (weighted and normalized) between soil samples according to the three DNA extraction procedures (ISO-11063, GnS-GII and ISOm). The legend shows the Z-scores (relative abundances are expressed as median centred Z-scores between all samples, and the colours scaled to standard deviations). Subcells A and B in the heat map have been highlighted by yellow squares and numbered to identify significant differences in the relative abundance of particular fungal genera according to DNA extraction procedure.

