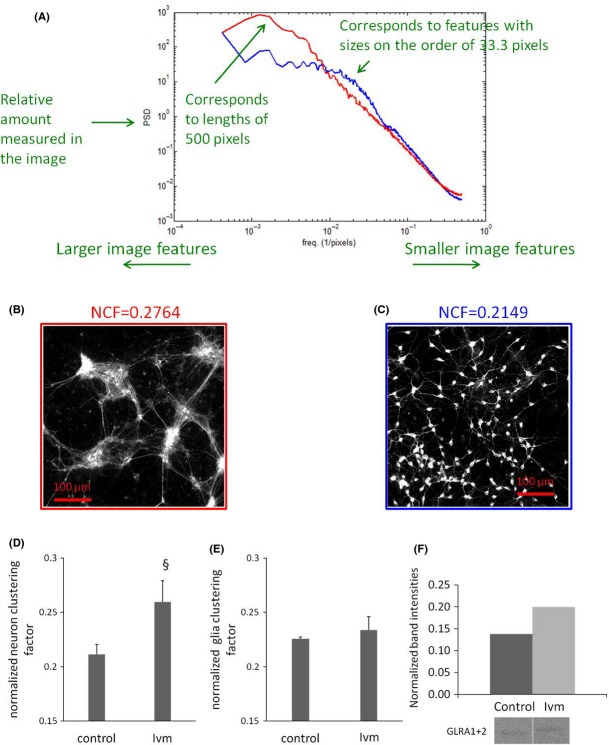
Figure 3.
Depolarized cell membrane causes mature neurons assemble into aggregates. (A) Cluster analysis; y axis of the plot is power spectral density and, x axis is spatial frequency, which has units of pixels−1. Red line corresponds to Panel B image and blue to Panel C image. Single-channel images taken from (B) Ivm-treated cells (3 weeks cocultures, 1 μmol/L, 24 h) and (C) from Control (not treated with ivm) are shown here as representative. A large aggregate is equal to one and random organization (no aggregation) is 0. (D) Ivm caused significant neuronal aggregation. (E) A very little glial aggregation was observed (E). §P ≤ 0.01. N = 18 images, 54,000 cells in total. (F) Western blot data showing increased GLR production in cells with depolarized Vmem (Ivm). Band intensities were normalized to one taken as the highest intensity band.

