Figure 2.
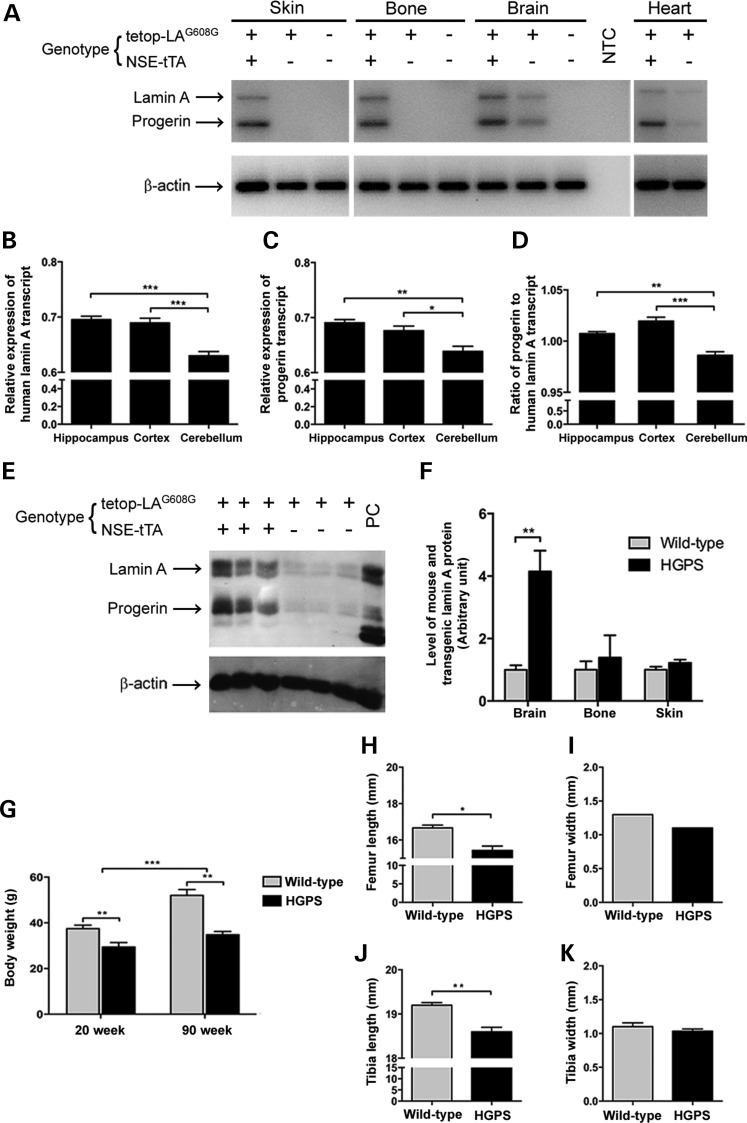
Transgenic lamin A/progerin expression in mouse. (A) RT-PCR of skin, bone, brain and heart tissues from HGPS, single transgenic and wild-type mice using a human lamin A and progerin-specific assay. Presence or absence of the transgene is indicated with + or –, respectively. (B–D) Relative transcript level of human lamin A and progerin in three different regions of the brain: hippocampus, cortex and cerebellum. (E) Western blot analysis of protein extracts from mouse brain tissue using a transgene-specific lamin antibody (anti-human lamin A/C, clone JoL2). Protein extracts from a HGPS patient were loaded as a positive control (PC). (F) Quantification of relative protein levels using densitometry. (G) Body weights of the HGPS and wild-type animals. (H–K) Bone length and width in HGPS compared with wild-type animals. NTC, no template control. Values represent mean ± SEM (*P < 0.05, **P < 0.01–0.001, ***P < 0.001).

