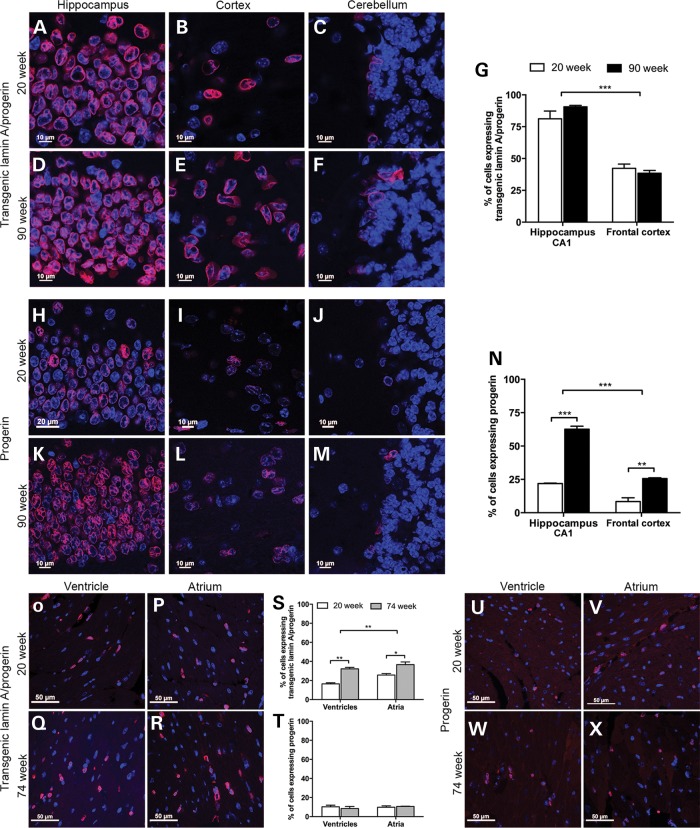
Figure 3.
Quantification of the transgenic lamin A/progerin and progerin expression in the brain and heart. (A–F) Immunofluorescent labeling of transgenic lamin A/progerin in three different regions of the brain, including the CA1 region of hippocampus, frontal cortex and the Purkinje cell layer of the cerebellum, of the HGPS animals. For both age groups, almost all cells were positive for the transgenic lamin A/progerin in the hippocampus, while in the cerebellum, there were very few positive cells. (G) Quantification of transgene-positive cells in the CA1 region of the hippocampus and the frontal cortex. (H–M) Immunofluorescent labeling of progerin in three different regions of the brain of HGPS animals. (N) Quantification of progerin-positive cells in the CA1 region of the hippocampus and the frontal cortex. (O–R) Immunofluorescent labeling of transgenic lamin A/progerin in the heart from HGPS animals at 20 or 74 weeks of age. (S and T) Quantification of cells expressing transgenic lamin A/progerin or progerin. (U–X) Immunofluorescent labeling of progerin in the ventricles and atria from the HGPS animals. Images of immunofluorescent staining were merged with DAPI. Values represent mean ± SEM (*P < 0.05, **P < 0.01–0.001, ***P < 0.001).

