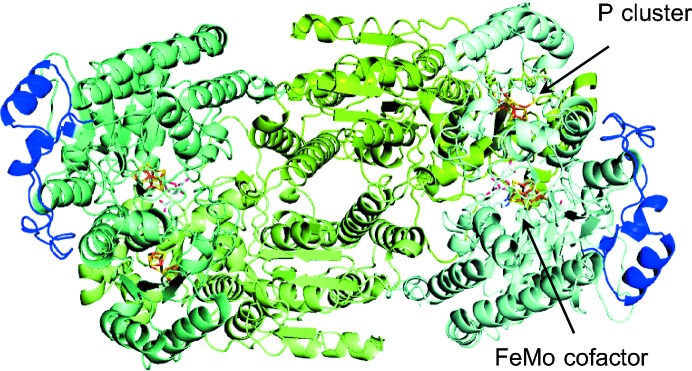
Figure 1.

Ribbon representation of the Cp1 tetramer viewed down the molecular (noncrystallographic) twofold symmetry axis. The α-subunits are shaded in pale cyan and teal, except for the long insertion loops (residues α376–α429), which are highlighted in blue. The β-subunits are colored split pea and pale green. The FeMo cofactors and the P clusters are depicted as sticks, with C atoms shown in light gray, N atoms in blue, O atoms in red, S atoms in yellow, Fe atoms in orange and Mo atoms in cyan.
