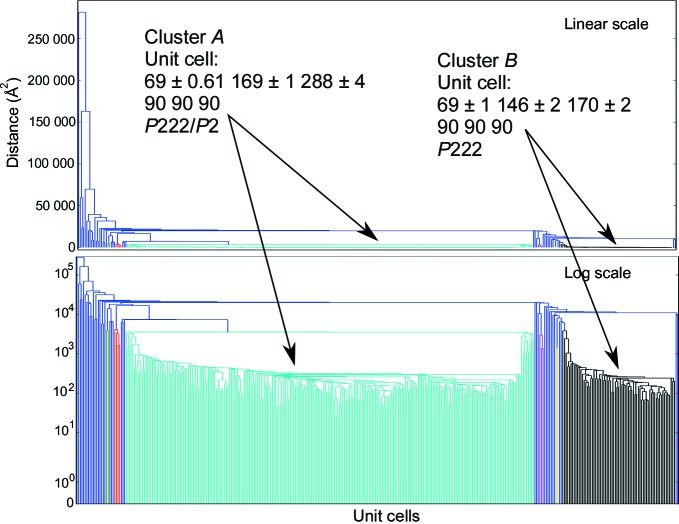
Figure 1.
Hierarchical clustering of the test data, with both a linear (top) and a log (bottom) y axis. Each branch of the tree below the threshold (5000 Å2) is defined as a cluster and colored individually. Single-element clusters are labeled in blue. The two crystal forms are shown in green and black, representing the long-cell and short-cell forms, respectively. The median of each cluster can then be used as a target in order to obtain significantly higher indexing rates.

