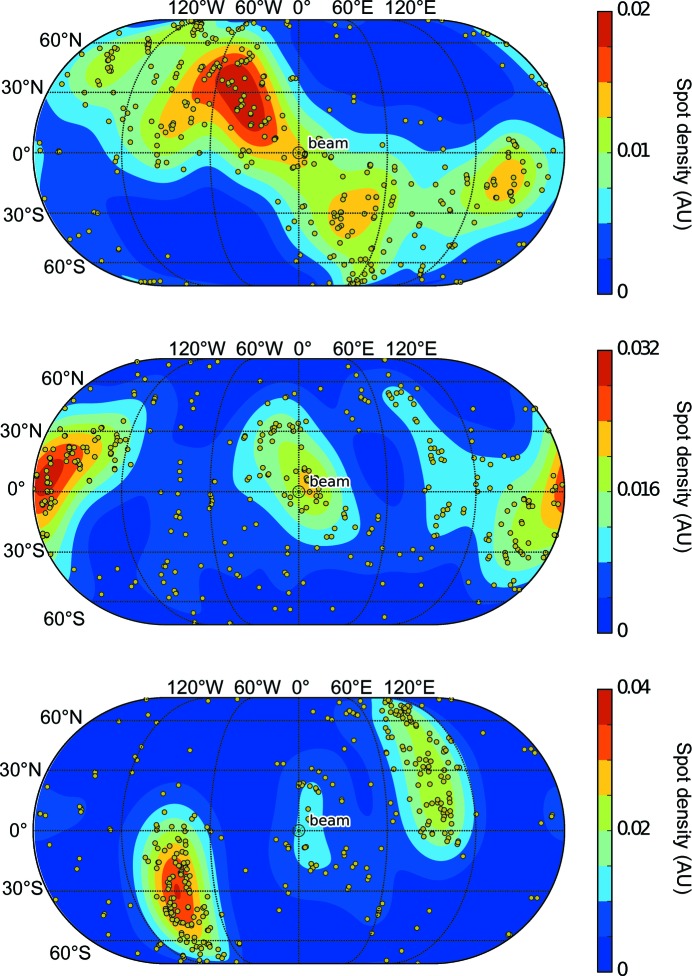
Figure 2.
Orientational distribution of real-space axes (a axis, top; b, middle; c, bottom) from the test sample, showing a significant amount of bias, probably owing to the preferred orientations of a crystal within the loop. The unit vector describing the direction orientation of the crystal axis is projected onto a unit sphere, and its orientation relative to the beam is shown in terms of latitude/longitude for ease of interpretation. Thus (0, 0) is along the beam, North/South represent up/down and East/West represent right/left. This tool is complementary to the PHENIX reflection viewer (phenix.data_viewer; Adams et al., 2010 ▶), which visualizes any missing wedges in reciprocal space, since it provides a direct reference back to the laboratory frame, allowing experimental adjustments to be made where possible. For each crystal, the laboratory-frame direction of the three real-space axes is shown as a yellow spot. The averaged density of real space axes is added to help in the interpretation of trends.

