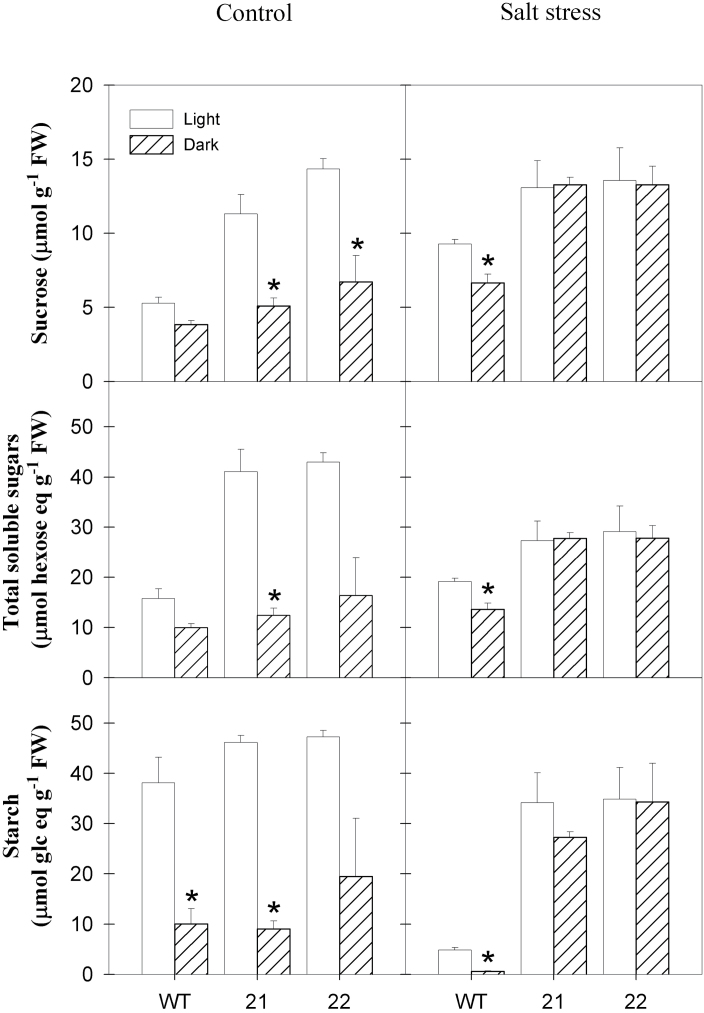
Fig. 3.
Diurnal carbohydrate turnover in source leaves of StSXD1-silenced potato plants challenged with salt stress. Sucrose, total soluble sugars (sum of glucose, fructose, and sucrose) expressed as hexose equivalents and starch contents (expressed as glucose equivalents) were measured in middle leaves (leaf 8) at the end of the light (white bars) and dark (black bars) period. Light samples were collected as stated in the legend to Fig. 2; dark samples were collected immediately before the end of the subsequent dark period. Left panels, control plants; right panels, salt-treated plants; WT, wild type. Data represent the mean ± SE of four individual plants. Data were analysed by t-test and significant differences between light and dark period within a genotype are indicated by an asterisk (P < 0.05).

