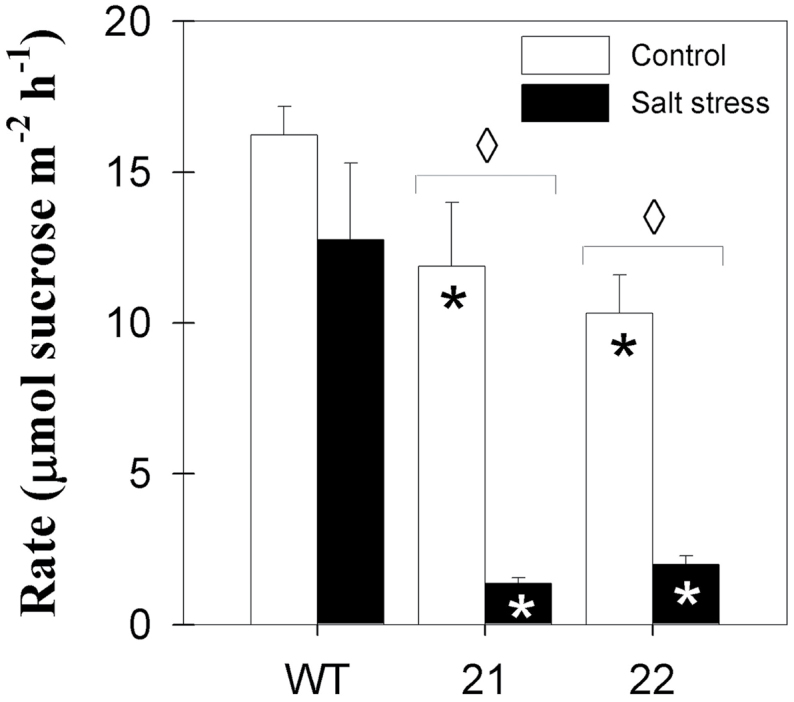
Fig. 5.

Changes in sucrose exudation rate of source leaves upon salt treatment. Samples were taken from middle leaves (leaf 9) and were collected 19 days after the onset of treatments (salt stress, black bars; control, white bars). Data represent the mean ± SE of four individual plants. Data were analysed by t-test; significant differences between the transgenic lines and the wild type within a treatment are indicated by a black asterisk (control treatment) or a white asterisk (stress treatment), while diamonds indicate significant differences between control and salt stress within a genotype (P < 0.05). WT, wild tye.
