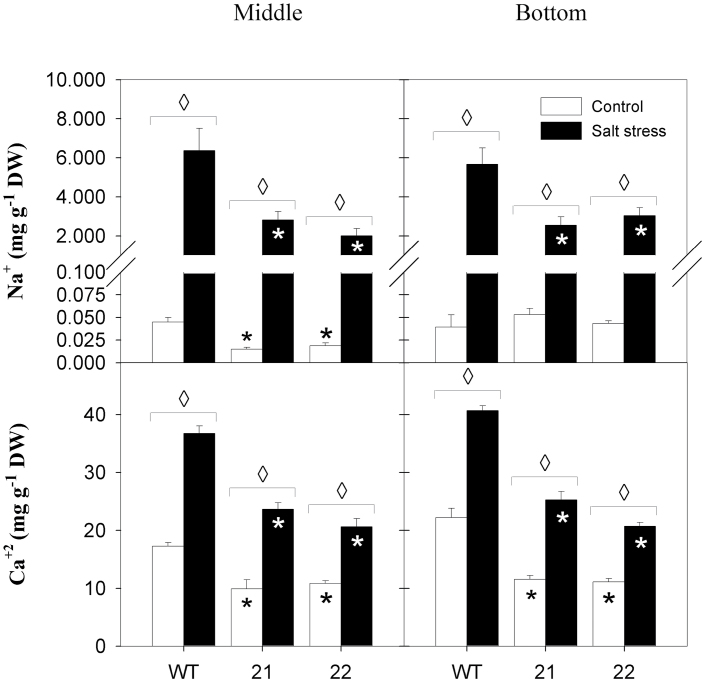
Fig. 6.
Effects of salt treatment on sodium and calcium content in source leaves. Sodium (top panels) and calcium contents (bottom panels) are depicted on a dry weight (DW) basis. Left panels represent middle leaves (leaf 8); right panels represent bottom leaves (leaf 11). Samples were collected 19 days after the onset of treatments (salt stress, black bars; control, white bars) and data represent the mean ± SE of four individual plants. Data were analysed by t-test; significant differences between the transgenic lines and the wild type (WT) within a treatment are indicated by a black asterisk (control treatment) or a white asterisk (stress treatment), while diamonds indicate significant differences between control and salt stress within a genotype (P < 0.05).

