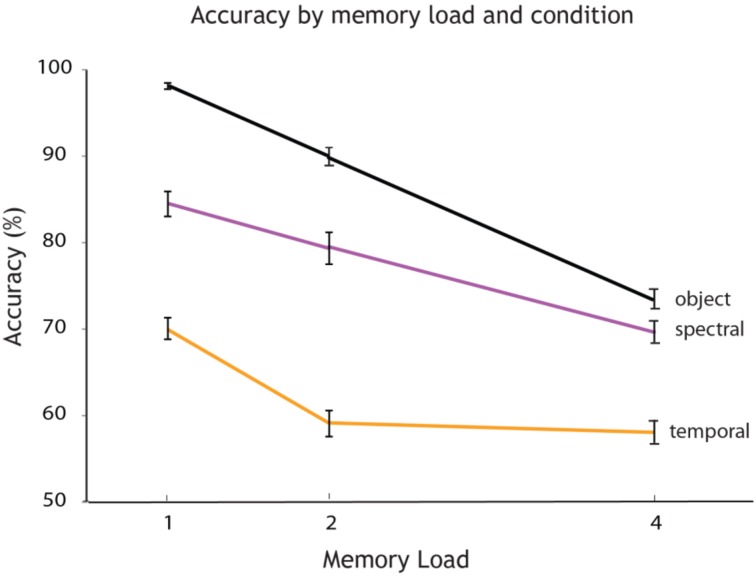
Figure 3.
Accuracy varies by memory load and experimental condition. Overall accuracy (percentage correct) for every memory load (1, 2, and 4 auditory objects presented within a sequence). The plot shows how accuracy decreases with an increase in memory load for each experimental condition: single feature spectral condition (in rose), single feature temporal condition (in orange) and object condition (in black).

