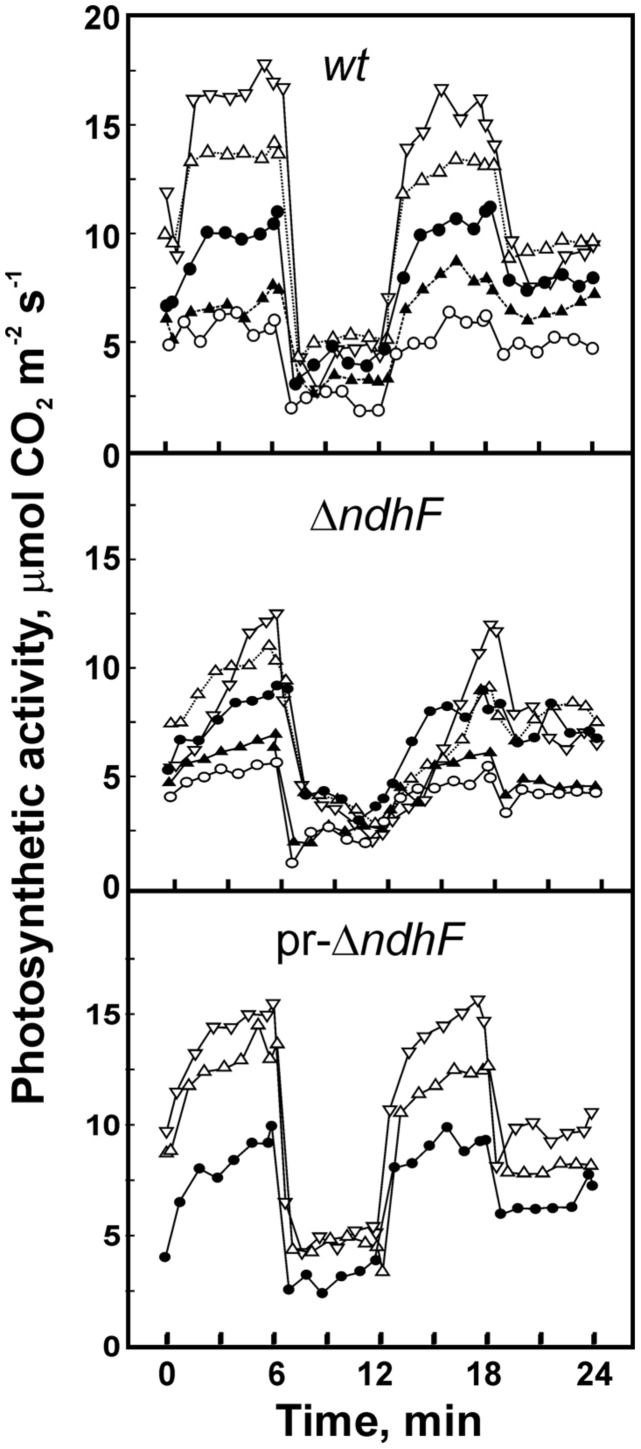
FIGURE 2.
Effect of CO2 concentration on photosynthetic rate under fluctuating light. Assays were carried out with wt, ΔndhF, and pr-ΔndhF tobacco leaves and the figure shows representative graphics of 3–8 different series of experiments. After a 15 min acclimation at 130 μmol m-2 s-1 PAR, the leaf region entrapped in the climatic chamber was subjected to successive 6 min periods (starting at 0 time in the figure) of light intensities, abruptly changing according to the sequence 870, 61, 870, and 130 μmol m-2 s-1 PAR. The concentration of CO2 varied for each sequence of light treatments as adjusted to (in ppm): 260 (-◯-), 312 (-▲-), 365 (-●-), 475 (-Δ-), and 625 (-▽-).

