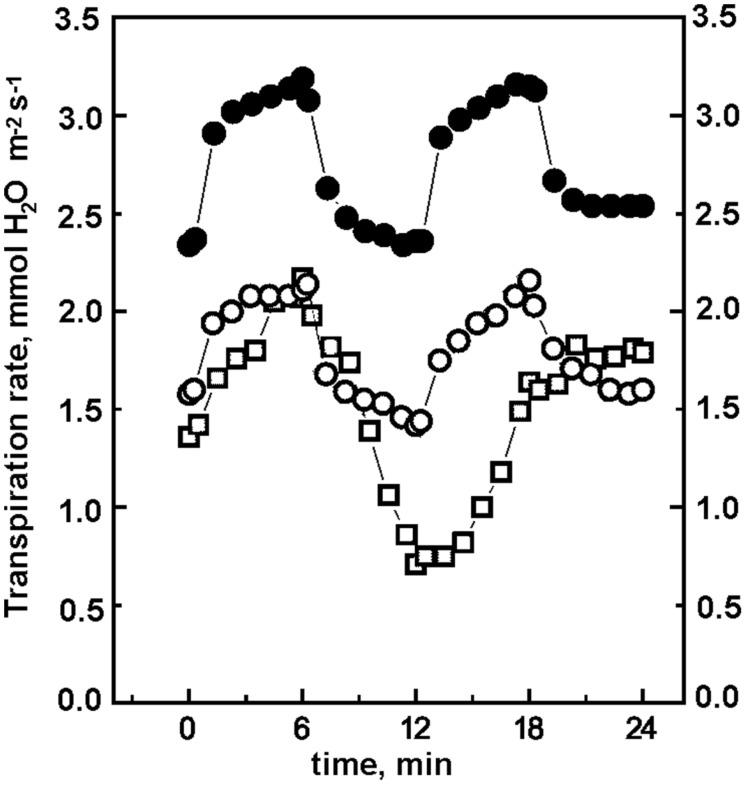
FIGURE 3.
Transpiration rates of wt, ΔndhF, and pr-ΔndhF tobacco plants at 470 ppm CO2 and fluctuating light. After 15 min acclimation at 130 μmol photon m-2 s-1 PAR, the leaf region entrapped in the climatic chamber was subjected to successive 6 min periods (starting at 0 time in the figure) of light intensities, abruptly changing according to the sequence 870, 61, 870, and 130 μmol photon m-2 s-1 PAR. Transpiration rates were measured as described in methods. wt (-●-), ΔndhF (-□-), and pr-ΔndhF (◯).

