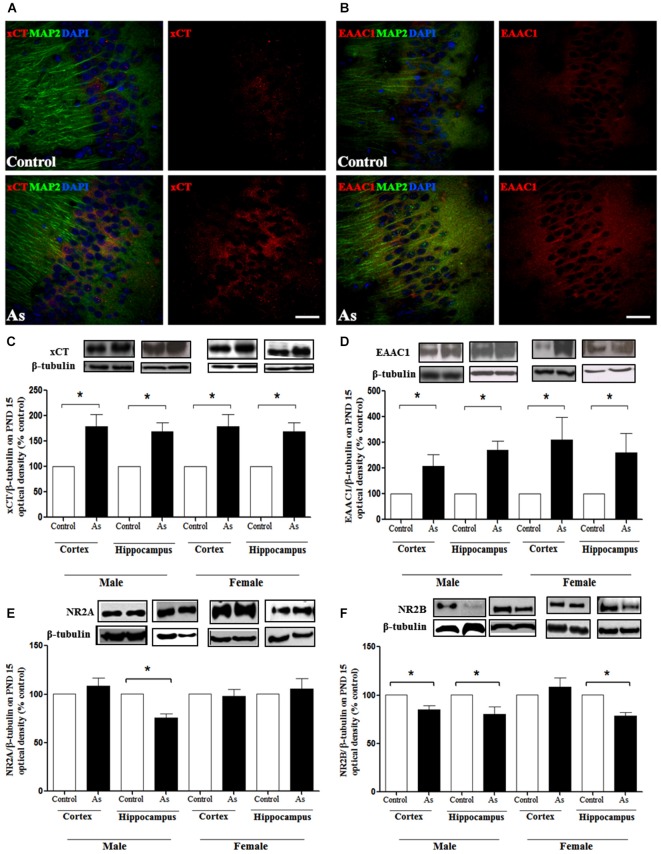
Figure 4.
Cystine/cysteine and glutamate transporters expression in control and gestational exposed mice on PND 15. Confocal images of (A) xCT and (B) EAAC1 expression in control and PND 15 CA1 hippocampal cells. Neuron marker anti-MAP2 (green), xCT (red) or EAAC1 (red). Nucleus were counterstained with DAPI (blue). Scale bar, 30 μm. The cortex and hippocampus regions were removed from males and females and processed for western blotting as described in Materials and Methods for (C) xCT; (D) EAAC1;(E) NMDAR NR2A and; (F) NMDAR NR2B subunits. Densitometric evaluation of the blot images was performed using β-tubulin as loading control. Bars represent mean ± SE relative to control values, n = 4–6. Data were analyzed using Student’s t-test. (*) Significantly different from controls,*P < 0.05, **P < 0.01,***P < 0.001. Representative blot images are shown.

