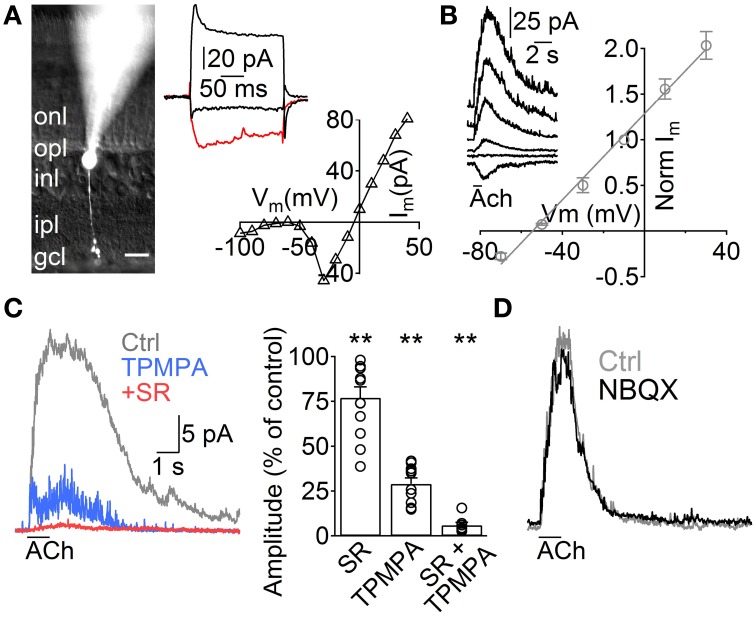
Figure 1.
ACh induces GABA release from A17 cells onto rod bipolar cells. (A) Left, image of a rod bipolar (RB) cell filled with Lucifer yellow during whole-cell patch clamp recordings. Scale bar indicates 10 μm. Right top, current responses from the cell in the left to voltage steps from −60 to −100, −20 (red trace) and 40 mV. Right bottom, current-voltage relationship for the same cell (10 mV voltage steps from −120 to 40 mV). (B) Left, representative current responses of RB cells to puff applications of ACh (1 mM, 1 s) at different holding potentials. Right, normalized amplitude of ACh responses in RB cells plotted against the holding potential (n = 4). (C) Traces showing the effect of GABAC receptor–specific antagonist TPMPA (50 μM) and GABAA antagonist SR95531 (SR, 10 μM) on ACh-evoked IPSCs in RB cells. (Vhold = 0 mV). Right, bar plot summarizes the effect of both GABA receptor antagonists applied separately or combined on ACh-induced responses. (D) Traces depict the lack of effect of AMPA/Kainate receptor antagonist application (NBQX 5 μM) in ACh-induced IPSCs (see text). Two-tailed paired t-test, **p < 0.01.

