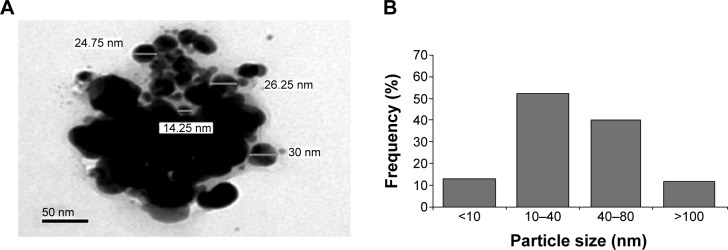
Figure 2.

Characterization of the AgNPs.
Notes: TEM image of the particles (A). The size distribution histogram generated by using a TEM image (B).
Abbreviations: AgNPs, silver nanoparticles; TEM, transmission electron microscopy.

Characterization of the AgNPs.
Notes: TEM image of the particles (A). The size distribution histogram generated by using a TEM image (B).
Abbreviations: AgNPs, silver nanoparticles; TEM, transmission electron microscopy.