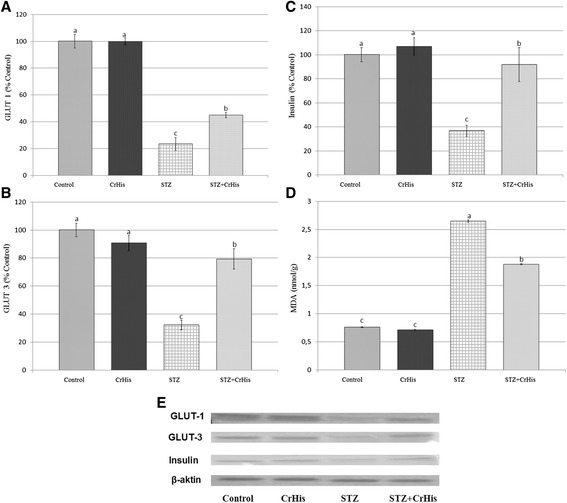
Figure 1.

Effect of chromium supplementation on the expression, GLUT1 (Panel A), GLUT3 (Panel B), insulin (Panel C), MDA (Panel D) values and density of proteins (Panel E) in the retina tissue regions of DR rats. Data are means of quadruplets of assays and expressed as relative to control (%). Blots were repeated at least 3 times (n = 3) and a representative blot for each is shown. Actin was included to ensure equal protein loading. Values are LS means ± SE. Different letters within the retina parts indicate statistical differences among groups (p < 0.05).
