Abstract
AT1 receptor (AT1R) antagonists exert their antihypertensive effects by preventing the vasoconstrictive hormone AngII to bind to the AT1 receptor. It has been proposed that these biological effects are mediated through a two-step mechanism reaction. In the first step, they are incorporated in the core of the lipid bilayers and in the second step they reach the active site of the receptor through lateral diffusion. In this model, drug/membrane interactions are key elements for the drugs achieving inhibition at the AT1 receptor. In this work, the interactions of the prodrug candesartan cilexetil (TCV-116) with lipid bilayers are studied at molecular detail. Solid-state 13C-CP/MAS, 2D 1H-1H NOESY NMR spectroscopy and in silico calculations are used. TCV-116 and olmesartan, another drug which acts as an AT1R antagonist are compared for their dynamic effects in lipid bilayers using solid-state 2H-NMR. We find a similar localization of TCV-116 compared to other AT1 antagonists in the intermediate polar region. In addition, we can identify specific local interactions. These interactions may be associated in part with the discrete pharmacological profiles observed for different antagonists.
Keywords: Candesartan cilexetil (TCV-116), Olmesartan, Lipid bilayers, Solid-state NMR spectroscopy, In silico calculations, Drug/membrane interactions
1. Introduction
Angiotensin II (AngII) receptor blockers (ARBs) represent a class of amphiphilic molecules that act on the renin angiotensin aldosterone system (RAAS) by preventing the vasoconstrictive hormone AngII to exert in a pathological state its detrimental effects on the AT1 receptor (AT1R) [1,2]. A two-step model has been proposed to account for the molecular basis of their antihypertensive action. More specifically, in the first step, they are incorporated into the lipid bilayers through the lipid–water interface while in the second step they laterally diffuse and reach the active site of the AT1 receptor [3–5].
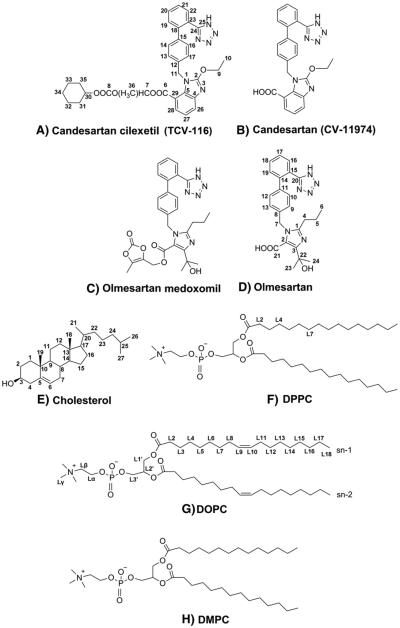
The prodrug candesartan cilexetil shown in Fig. 1A (TCV-116) is esterified at the carboxyl group of the AT1R antagonist marketed drug candesartan (CV-11974) by the cyclohexylocarbonyloxyethyl segment (Fig. 1B) [6,7]. This drug was found to possess interesting drug/membrane interactions when compared with other AT1R antagonists [7]. Olmesartan medoxomil (Fig. 1C) is another esterified AT1R antagonist prodrug and it is metabolized in the gastrointestinal tract to olmesartan (Fig. 1D) [8,9].
Fig. 1.
Structures of the AT1R antagonists, phosphatidylcholines and cholesterol used in our studies. L2, L4 and L7 present the sites of deuteration of DPPC. For the terminology of the positions see [10].
The cellular membrane is a complex system comprising of a plethora of proteins and lipids as well as cholesterol, a molecule of paramount biological importance (Fig. 1E) [11–16].
Phosphatidylcholines (PCs) are the most abundant lipid species in the plasma membranes of the vascular smooth muscle cells [17] and sarcolemma cardiac membranes but also other kinds of lipids play a significant role in the membrane functionality [18]. The most frequently found PCs consist of oleic, linoleic and dipalmitoyl alkyl chains. Fully hydrated La-dipalmitoyl-phosphatidylcholine (DPPC) (Fig. 1F) lipids are used extensively in biophysical studies because they spontaneously form multilamellar bilayers whose mesomorphic changes occur in a convenient and biologically related temperature range between 25 and 50 °C. Their dynamic and thermotropic properties have been studied using a variety of physical chemical techniques [19–27] and Molecular Dynamics (MD) simulations [28]. These studies revealed also that their ARB partition coefficient in the fluid state resembles that of natural plasma membranes of the vasculature [17,18]. Briefly, the phosphatidylcholine bilayers at low temperatures occur in the lamellar gel phase (Lβ) and at higher temperatures in the liquid-crystalline phase (Lα). Their phase transition is accompanied by several structural changes in the lipid molecules and trans-gauche isomerization of the acyl conformation. The average number of gauche conformers of the PCs alkyl chains, indicates the effective fluidity. In addition to the temperature, the effective fluidity depends on the presence of a drug molecule intercalating between the lipids.
In our previous work [7,29,30] we have left opened questions regarding the specific lipid interactions and topographical position of TCV-116 in lipid bilayers. In this study, solid-state high resolution 1H NMR and 13C-CP/MAS along with stationary 2H-NMR spectra of specifically deuterated DPPC were obtained to get detailed information on the molecular basis of the interactions developed among TCV-116 with various phospholipid bilayers. Analogous experiments were performed for the drug olmesartan in order to compare their specific molecular interactions with the lipid bilayer. 2D 1H-1H NOESY experiments were also performed to acquire valuable information on the interactions within 5 Å between TCV-116 and phosphatidylcholine bilayers of dimyristoyl and dioleolyl phosphatidylcholine bilayers (Fig. 1G, H). This pair of molecules is chosen for comparison because in previous studies it was found that TCV-116 and olmesartan show very beneficial drug/membrane interactions such as mild electrostatic repulsion, small thinning effect, strong decrease of fluidity and formation of drug rich and poor domains [29,30]. In addition, olmesartan possesses carboxylate group and hydroxyl segments, which may lead the molecule in the anchoring at a more hydrophilic environment in respect to TCV-116 as it will be shown. Olmesartan is a newer drug and has extended molecular features resembling that of prototype losartan, studied in the last decade by our laboratory [3,7,31,32]. The role of the biologically important molecule cholesterol is also sought in this study.
2. Materials and methods
2.1. Materials
Candesartan cilexetil (TCV-116) was kindly provided by Medochemie Hellas A.E. (Pharma Cypria). Olmesartan was kindly donated by Daiichi Sankyo Pro Pharma, Japan. DPPC and deuterated lipids were purchased from Avanti Polar Lipids Inc. (Alabaster, AL). Cholesterol and deuterium depleted water were purchased from Sigma Aldrich (St. Louis, MO).
2.1.1. Sample preparation
DPPC and TCV-116 stock solutions were prepared by dissolving weighted amounts of dry lipid and TCV-116 powder in chloroform. The drug concentrations used were x = 0.1 and 0.2 (10 mol% and 20 mol% respectively). Appropriate amounts of drug and cholesterol were used in the ternary mixtures. The organic lipid/TCV-116, lipid/olmesartan or lipid/TCV-116/cholesterol solutions were then evaporated at room temperature under a gentle stream of nitrogen and thereafter placed under vacuum for 12 hours in order to form a thin lipid film on the bottom of glass vials. The obtained mixtures were fully hydrated (50% wt/wt deuterium depleted water) in order to achieve multilamellar vesicles (MLVs). Approximately 20 mg of each sample was packed tightly in 3.2 mm ZrO2 rotors.
2.2. Methods
2.2.1. Solid-state 2H NMR spectroscopy
2H solid-state NMR spectra were recorded on a Bruker Avance 600 MHz WB spectrometer equipped with a 4 mm HX double resonance MAS probe. Spectra were recorded without spinning the 4 mm MAS rotor using a solid echo sequence with an echo delay of 35 μs and a pulse length of 2.5 μs.
2.2.2. 1H and 13C CP/MAS NMR spectroscopy
All 1D 1H and 13C NMR spectra recorded were obtained using a 4 mm MAS rotor on a Bruker Avance III 850 WB spectrometer equipped with a Bruker 4 mm MAS HCN probe. The temperature was set to 27 °C and 10 kHz MAS was used. One pulse proton spectra were recorded using a 3 μs 1H 90° pulse. 13C-CPMAS spectra were obtained with a 3 μs 1H 90° pulse, a 5 ms CP step using 80%–100% ramp and 67 kHz SPINAL64 1H decoupling during the acquisition time of 40 ms [33]. Chemical shifts were referenced indirectly via the downfield signal at 40.49 ppm of adamantane to DSS.
2.2.3. 2D 1H-1H NOESY experiments
2D 1H-1H NOESY experiments were recorded using a 3.2 mm MAS rotor on a Bruker Avance III 850 WB spectrometer equipped with a Bruker 3.2 mm MAS HCN probe. The temperature was set to 37 °C and 23 kHz MAS was used. The 1H 90° pulse was set to 2.5 μs; the best mixing times are reported in figure captions. The experiment with protonated DMPC was recorded using 8 scans and acquisition times in the direct and indirect dimension of 200 ms and 10 ms, respectively. The number of increments in the direct dimension was 464. For deuterated DMPC 16 scans and acquisition times in the direct and indirect dimension of 200 ms and 11 ms, respectively, were used. The number of increments in the direct dimension was 512. The 2D data were recorded using the TPPI method and Fourier transformed using Gaussian Line Broading and 8192 data points in the direct dimensions and a QSINE window function and 4096 data points in the indirect dimensions.
2.2.4. Molecular modeling
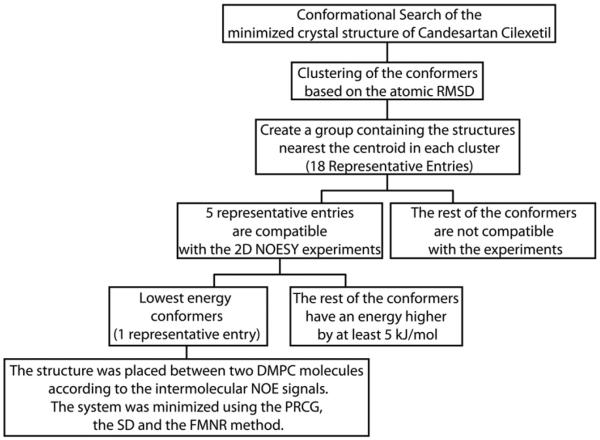
The crystal structure of TCV-116 9 (CSD reference code: FETWEH) was minimized using the Optimized Potential for Liquid Simulations (OPLS-2005) force field as it is implemented in MacroModel 9.9 (Schrodinger Suite 2012 update 2) [34] using water as a solvent. The compound was subjected to 5000 iterations by applying the Polak–Ribiere conjugate gradient (PRCG) general method for energy minimization. The mixed torsional/low-mode method has been applied for the conformational search using a maximum of 1000 number of conformers and only the best low energy conformers were kept. The energy window for saving structures was set at 5.12 kcal/mol. The conformational search produced 136 different conformers. The clustering of the conformers into families of similar structure was done using the conformer/cluster.py script available in the Schrodinger Suite. To generate the RMSD matrix all heavy atoms were taken into account. The average linkage method was used for the clustering. The clustering strain was 1.003 and the best number of clusters was 18. A new group of conformers was created containing the structures near the centroid for each cluster. According to the 2D 1H-1H NOESY experiments of the d54-DMPC/TCV-116 bilayers there are intramolecular interactions between the aromatic ring A (H13-17) and cyclohexane (H33-35). Only five representative entries are compatible with this information. Only one of these five structures is a low energy conformer while the other four have an energy higher by at least 5 kJ/mol. The low energy conformer was transformed within two DMPC molecules in a topographical position supported by the solid-state 2D NOESY results (Figs. 2 and 10).
Fig. 2.
Algorithm used during the construction of Fig. 10.
Fig. 10.
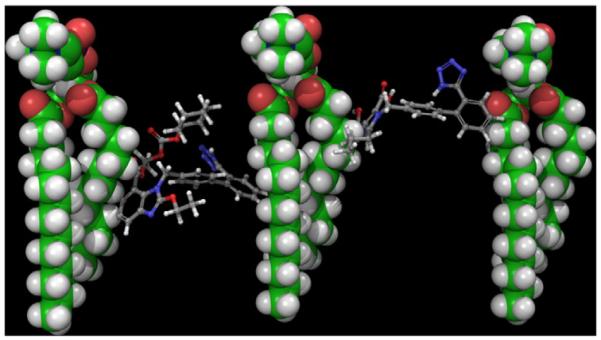
Localization of TCV-116 (left) and olmesartan (right) between two adjacent DMPC phospholipids.
3. Results and discussion
3.1. Solid-state 2H NMR
We have obtained spectra from drug-containing or drug-free lipid bilayer preparations of DPPC 2H-labeled at three different sites. The 2H-labels were regioselectively placed; (1) at the 2-methylene group of both sn-1 and sn-2 chains (1,2[2,2-2H2]-DPPC); (2) at the 4-methylene group of the sn-1 and sn-2 chains (1,2[4,4-2H2]-DPPC); (3) and at the 7-methylene group of the sn-1 and sn-2 chains (1,2[7,7-2H2]-DPPC).
A deuterium nucleus gives rise to a doublet in a powder or an oriented sample because of the interaction between its electric quadrupole moment and the electric field gradient at the nuclear site. This interaction is of anisotropic nature and the spectral lines have a frequency difference of , which depends on the angle θ between the magnetic field and the axis of molecular ordering. In the liquid crystalline phase, the phospholipid bilayers have all θ values possible and the spectrum from 2H nuclei at one site in the molecule is a “powder pattern” in which the two principal peaks correspond to θ = 90° (perpendicular edges) and the two shoulders to θ = 0° (parallel edges). The separation between the two 90°-edges is defined as the quadrupolar splitting (ΔνQ). At phases below the main phase transition, the axial diffusion is intermediate or slow and this results in a broad, conical or rounded spectrum which does not show any sharp features. By studying the spectral shape as a function of temperature and ΔνQ changes attributed to the intercalation of the drug, information on the dynamic properties of the lipid bilayer, in the particular region where the 2H-label is placed, can be derived.
3.1.1. Spectra of 1,2[2,2-2H2]-DPPC preparations containing TCV-116
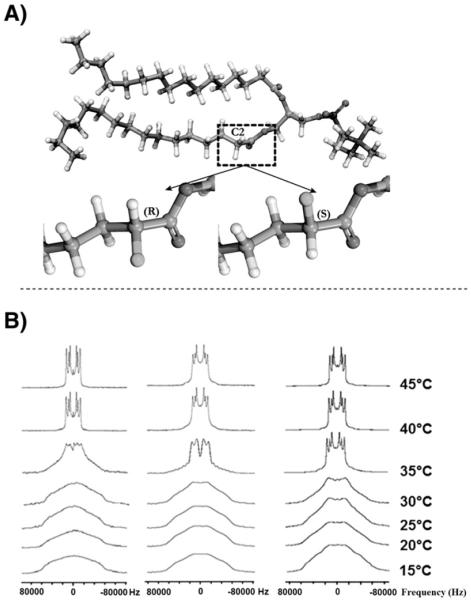
Fig. 3 illustrates the solid-state NMR spectra of 1,2[2,2-2H2]-DPPC bilayer preparations in the absence and presence of TCV-116 (x = 0.20). In the liquid crystalline phase (45 °C), the spectrum of DPPC bilayers shows three quadrupolar splittings 11,9 (2-S), 17,2 (2-R) and 26,2 (-CD2) kHz (Table 1) [35].
Fig. 3.
A) 3D representation of the 2R and 2S deuterated sites. B) (left) 2H NMR spectra of 1,2[2,2-2H2]-DPPC bilayer preparations alone at a temperature range of 15–45 °C, (middle) with TCV-116 (x = 0.20) and (right) with olmesartan (x = 0.20).
Table 1.
ΔvQ values of 1,2[2,2-2H2]-DPPC, 1,2[4,4-2H2]-DPPC and 1,2[7,7-2H2]-DPPC bilayers alone (A) with TCV-116 (B) and olmesartan (C) at a temperature range of 40–45 °C.
| T (°C) | 2-S (kHz) |
2-R (kHz) |
-CD2 (kHz) |
1,2[4,4-2H2] |
1,2[7,7-2H2] |
||||||||||
|---|---|---|---|---|---|---|---|---|---|---|---|---|---|---|---|
| A | B | C | A | B | C | A | B | C | A | B | C | A | B | C | |
| 40 | 11.9 | 13.6 | 12.5 | 18.1 | 19.4 | 17.9 | 27.5 | 28.2 | 27.0 | 25.8 | 27.1 | 25.5 | 27.2 | 29.3 | 26.8 |
| 45 | 11.9 | 13.7 | 12.4 | 17.2 | 18.7 | 17.1 | 26.2 | 27.3 | 25.6 | 24.3 | 25.6 | 24.1 | 25.0 | 27.0 | 25.0 |
Values are subjected to 1% error.
The presence of the drug results in the increase of ΔνQ values as it is shown in Table 1 at temperatures 40 and 45 °C, where bilayers are in the liquid crystalline phase indicating that it reduces its mobility.
At a temperature of 35 °C the DPPC bilayers with or without the presence of TCV-116 show a superimposition of gel and liquid components implying that lipid bilayers are in the Pβ′ state. At a temperature range of 15–30 °C the two samples show wide spectra (ca 120 kHz) with rounded-top peak. These spectra correspond to the gel phase (Lβ′). Three important observations are made: (a) ΔνQ of 2-S remained constant for the two preparations at the liquid crystalline phase; (b) ΔνQ of 2-R and CD2 decreased with increase of the temperature in the liquid crystalline phase; (c) TCV-116 causes an increase of ΔνQ in the liquid crystalline state.
3.1.2. Spectra of 1,2[4,4-2H2]-DPPC preparations containing TCV-116
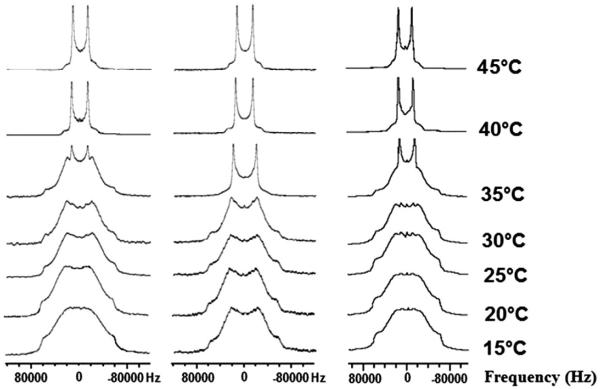
Fig. 4 shows the solid-state NMR spectra of 1,2[4,4-2H2]-DPPC bilayer preparations in the absence and presence of TCV-116 (x = 0.20).
Fig. 4.
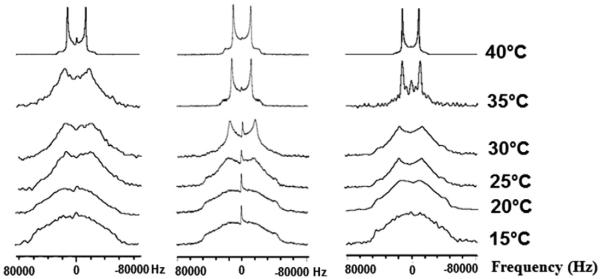
(left) 2H NMR spectra of 1,2[4,4-2H2]-DPPC bilayer preparations alone at a temperature range of 15–40 °C, (middle) with TCV-116 (x = 0.20) and (right) with olmesartan (x = 0.20).
As in the previous spectra (Fig. 3) in the temperature range of 15–25 °C the two samples show wide spectra (ca. 120 kHz) with rounded-top peak indicating that they are in the gel phase (Lβ′). At 30 °C the preparation containing the drug is in the Pβ′ phase as the gel and liquid components are evident. At 35 °C the lipid bilayer without TCV-116 is in the Pβ′ phase although with less liquid component compared to the preparation containing TCV-116 at 30 °C. The TCV-116 containing bilayer is already in the liquid crystalline phase at 35 °C. At 40 °C both preparations are in the liquid crystalline phase. It is eminent from the spectra that the drug exerts more significant action on this site as the phase transition appears at lower temperature.
As with the specific deuteration at site 2, the presence of the drug causes an increase of ΔνQ indicating that it intercalates in this region and makes the lipid bilayers more compact (Table 1).
3.1.3. Spectra of 1,2[7,7-2H2]-DPPC preparations containing TCV-116
Fig. 5 shows solid-state spectra of 1,2[7,7-2H2]-DPPC bilayer preparations containing TCV-116 (x = 0.20). The spectra at a temperature range of 15–30 °C show that the two preparations are in the gel phase. At 35 °C the spectrum of the drug-free 1,2[7,7-2H2]-DPPC bilayer preparations shows clearly the co-existence of two components, the broad gel-phase line shape and the sharp liquid crystalline Pake pattern. The preparation containing the TCV-116 is almost in the liquid crystalline phase. At 40 °C and above, both preparations are in the liquid crystalline phase. ΔνQ values in the liquid crystalline phase are higher in the drug containing lipid bilayers preparation (Table 1). The results show that drug has consistent effect in the upper segment of the lipophilic region regarding the increase of ΔνQ. Thus, its localization in this region results in the decrease of membrane mobility. Interestingly, the increase ranges between 4% and 8% at all positions except at 2-S where the increase was more significant reaching 14.2%.
Fig. 5.
(Left) 2H NMR spectra of 1,2[7,7-2H2]-DPPC bilayer preparations alone at a temperature range of 15–45 °C, (middle) with TCV-116 (x = 0.20) and (right) olmesartan (x = 0.20).
From the deuterated spectra it is evident that the most pronounced effect caused by the TCV-116 is at 35 °C (Figs. 3–5 and Fig. S1). In particular, the sample 1,2[4,4-2H2]-DPPC/TCV-116 at 35 °C (Fig. 4) is in the liquid crystalline phase while the sample 1,2[2,2-2H2]-DPPC/TCV-116 (Fig. 3) at the same temperature shows both gel and liquid crystalline components. Interestingly, the sample 1,2[7,7-2H2]-DPPC/TCV-116 (Fig. 5) is mostly in the liquid crystalline phase but still the phase transition is not completed. Thus, it appears that the TCV-116 affects the lipid bilayer phase transition in a not predicted way, exerting its maximum effect when the deuteration takes place at 4 site of sn-2 alkyl chain.
Generally, TCV-116 increases ΔνQ when DPPC is deuterated at 2, 4 and 7 sites meaning that when it is intercalated in the upper segment of lipophilic region, it decreases the fluidity of the lipid bilayers. These results are in agreement with other biophysical techniques used such as Small Angle X-ray diffraction, differential scanning calorimetry and Raman spectroscopy [30]. In a previous study, we have shown that psychotropic Δ8-tetrahydrocannabinol that anchors in the mesophase also increases ΔνQ when the lipid bilayers are deuterated at the same position. In contrast, the methylated analogue is embedded deeper in lipid bilayers and does not exert ΔνQ enhancement [36].
Our obtained ΔνQ values of solid-state 2H-NMR spectra differ from those reported in the literature for 41 °C for the used deuterated DPPC, although sample preparations were identical [37,38]. Most likely the observed differences can be attributed to a different temperature calibration.
3.1.4. Comparative effects of TCV-116 with olmesartan
For comparative purposes we performed identical experiments using olmesartan (Figs. 3–5). As it is shown, the effects of olmesartan are distinct. At 2′-S it causes a less significant increase of ΔνQ with respect to TCV-116 and at 2′-R and -CD2 it causes a decrease. Thus, this position has a bimodal effect not observed for TCV-116. The spectra in the temperature range of 15–45 °C show that between 15 and 30 °C the preparation containing olmesartan is in the gel phase and between 35 and 45 °C in the liquid crystalline phase. Interestingly, at 35 °C the incorporated olmesartan in 1,2[2,2-2H2]-DPPC bilayers triggers a larger effect compared to TCV-116. Olmesartan causes less effect at 1,2[4,4-2H]-DPPC. At 30 °C the 1,2[4,4-2H2]-DPPC/TCV-116 has more liquid component relatively to 1,2[4,4-2H2]-DPPC/olmesartan preparation. Below the phase transition 1,2[4,4-2H2]-DPPC/olmesartan bilayers are in the gel phase and above they are in the liquid crystalline phase as in 1,2[4,4-2H2]-DPPC/TCV-116 bilayers. Again, olmesartan causes a decrease in ΔνQ values in contrast to TCV-116. Thus, it appears that the effect of olmesartan is decreased as the deuterium label is deeper in the hydrophobic core. This is even more evident in 1,2[7,7-2H2]-DPPC bilayers. The spectra of 1,2[7,7-2H2]-DPPC/olmesartan bilayers resemble those of 1,2[7,7-2H2]-DPPC bilayers indicating that olmesartan has no significant effect deeper in the hydrophobic core. This is clearly seen in a comparison of the three preparations at 35 °C (see Figs. 3–5 and Fig. S1). 1,2[7,7-2H2]-DPPC and 1,2[7,7-2H2]-DPPC/olmesartan contain superimposed gel and liquid components, while the 1,2[7,7-2H2]-DPPC/TCV-116 bilayers are almost completely in the liquid crystalline phase.
These results show that 2H-NMR is a sensitive methodology to reveal detailed interactions of drugs in lipid bilayers. TCV-116 is a bulkier molecule which affects significantly the upper lipophilic segment. Olmesartan restraints its action only up to 2 positions. The two AT1R antagonists exert differential effects at the 2 position. Olmesartan exerts bimodal action by causing increase of ΔνQ at 2-S position in contrast with 2-R and -CD2 positions where it causes decrease. TCV-116 has a homogeneous effect at the three sites by increasing ΔνQ. These results are in agreement with reported logP values [37]. TCV-116 is more lipophilic and it is expected to embed itself deeper in the bilayer core.
3.2. 1H and 13C CP/MAS NMR spectroscopy of DOPC bilayers alone, with cholesterol and with cholesterol/TCV-116
Lipid packing is aggravated by the unsaturation due to the kinks formed. DOPC bilayers show a phase transition at very low temperature (Tm ≈ − 22 °C) [39]. Lipid packing can influence the fluidity of the membrane and in turn the rotation and diffusion of drugs within the membrane. More importantly, it is interesting to study the influence of drug properties in unsaturated membrane bilayers containing cholesterol. The stronger influence of cholesterol in saturated lipid bilayers versus unsaturated is already shown in the case of losartan [32].
3.2.1. 1H NMR spectra
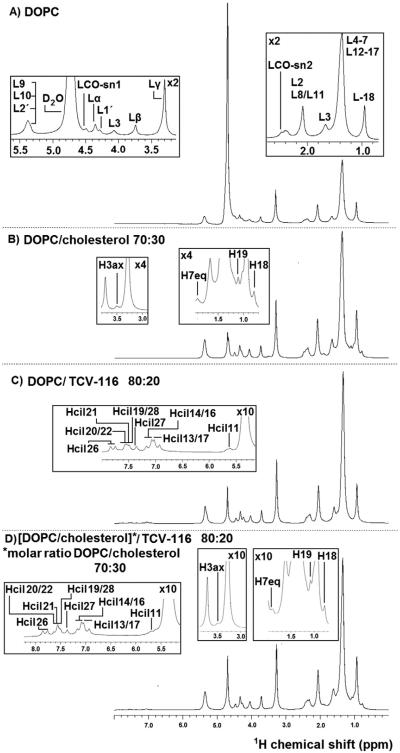
1H NMR spectrum of DOPC bilayers in D2O is shown in Fig. 6A. The obtained spectra compare well with published spectra and thus the published assignment was used; see Table 2 [10].
Fig. 6.
1H NMR spectra of (A) DOPC, (B) DOPC/cholesterol (molar ratio 70:30), (C) DOPC/TCV-116 (molar ratio 80:20), and (D) [DOPC/cholesterol]/TCV-116 (molar ratio 80:20) obtained at 27 °C using 850 MHz Bruker spectrometer.
Table 2.
DOPC 1H chemical shifts (ppm) of the preparations (a) DOPC, (b) DOPC/cholesterol, (c) DOPC/TCV-116, and (d) DOPC/cholesterol/TCV-116 obtained at 27 °C using 850 MHz Bruker spectrometer.
| Atoms or groups | DOPC/H2O | DOPC/D2O | Literature data (DOPC/H2O) [10] |
DOPC/cholest. (x = 0.30) |
DOPC/cholest. (x = 0.15) |
Literature data (x = 0.33) (H2O) [10] |
DOPC/TCV-116 (x = 0.10) |
DOPC/TCV-116 (x = 0.20) |
[DOPC/CHOL (x = 0.30)]/ TCV-116 (x = 0.20) |
[DOPC/CHOL (x = 0.15)]/ (x = 0.20) |
|---|---|---|---|---|---|---|---|---|---|---|
| Lα | 4.29 | 4.35 | 4.28 | 4.35 | 4.36 | 4.28 | 4.33 | 4.32 | 4.33 | 4.33 |
| Lβ | 3.68 | 3.74 | 3.70 | 3.73 | 3.75 | 3.70 | 3.72 | 3.71 | 3.72 | 3.71 |
| Lυ | 3.24 | 3.30 | 3.26 | 3.29 | 3.31 | 3.26 | 3.28 | 3.27 | 3.28 | 3.27 |
| L1′ | 4.22 | 4.29 | 4.24 | 4.29 | 4.30 | 4.24 | 4.25 | 4.24 | 4.27 | 4.25 |
| L2′ | 5.29 | |||||||||
| L9 | 5.33 | |||||||||
| L10 | 5.30 | 5.38 | 5.29 | 5.36 | 5.38 | 5.31 | 5.36 | 5.35 | 5.36 | 5.36 |
| L3′ | 4.00 | 4.07 | 4.01 | 4.07 | 4.07 | 4.01 | 4.04 | 4.03 | 4.05 | 4.04 |
| LCO-sn1 | 4.43 | 4.50 | 4.46 | 4.49 | 4.50 | 4.42 | 4.46 | 4.45 | 4.47 | 4.46 |
| LCO-sn2 | 2.41 | 2.47 | 2.44 | 2.47 | 2.48, | 2.48 | 2.41 | 2.39 | 2.42, 2.37 |
2.41, 2.36 |
| L2 | 2.34, 2.31 |
2.40, 2.39 |
2.36 | 2.41, 2.36 |
2.42, 2.37 |
2.36 | 2.35, 2.31 |
2.33, 2.30 |
2.32 | 2.31 |
| L3 | 1.60 | 1.66 | 1.63 | 1.66 | 1.67 | 1.61 | 1.61 | 1.59 | 1.62 | 1.61 |
| L4-7, L12-17 | 1.29 | 1.36 | 1.32 | 1.36 | 1.37 | 1.39, 1.34, 1.30 |
1.34 | 1.33 | 1.35 | 1.34 |
| L8/L11 | 2.01 | 2.08 | 2.01 | 2.08 | 2.09 | 2.03, 2.02 |
2.06 | 2.05 | 2.07 | 2.06 |
| L18 | 0.88 | 0.95 | 0.89 | 0.94 | 0.96 | 0.89 | 0.94 | 0.93 | 0.94 | 0.94 |
In Figs. 6B and Fig. S2 the 1H NMR spectra of DOPC bilayers containing 30% and 15% molar ratio of cholesterol are shown respectively, and in Table 2 the 1H chemical shifts of the corresponding spectra and the results by Zorin et al. [10] are reported. The spectra were consistent with those reported in the literature (DOPC/CHOL 33%). The observed minor deviations (less than 2%) are attributed to the different concentrations used. Additional peaks derived from steroidal rings A and B as well as H18 and H19 are observed (Figs. 6B, S2 and Table 3). Protons of the cholesterol alkyl chain are not resolved because they are overlapped with those of the alkyl chains of the phospholipid. The additional peaks attributed to cholesterol in the two preparations are identical and more pronounced in the bilayer containing the higher percentage of cholesterol as expected.
Table 3.
Cholesterol's 1H Chemical shifts (ppm) for DOPC/cholesterol samples at 27 °C.
| Atoms or groups |
DOPC/Cholest. (x = 0.30) |
DOPC/Cholest. (x = 0.15) |
Literature data (x = 0.33) [10,40] |
[DOPC/Cholest (x = 0.30)]/ TCV-116(x = 0.20) |
[DOPC/Cholest (x = 0.15)]/ TCV-116(x = 0.20) |
|---|---|---|---|---|---|
| H3ax | 3.50 (m) | 3.50 | 3.50 | 3.48 | 3.48 |
| H7eq | 1.90 | 1.91 | 1.87 | 1.90 | 1.91 |
| H18 | 0.79 | 0.79 | 0.77 | 0.77 | 0.76 |
| H19 | 1.10 | 1.11 | 1.08 | 1.07 | 1.06 |
Figs. 6C and S2 illustrate the 1H NMR spectra of DOPC/TCV-116 (x = 0.20) and, DOPC/TCV-116 (x = 0.10) respectively, and in Tables 2 and 4 the chemical shifts of the two preparations are reported. The spectra are almost identical and peaks are of similar linewidths. The same applies and for the spectra containing DOPC/cholesterol/TCV-116 and DOPC/cholesterol.
Table 4.
1H Chemical shifts (ppm) for the preparations DOPC/TCV-116 (x = 0.10), DOPC/TCV-116 (x = 0.20), [DOPC]/cholesterol (x = 0.30)]/candesartan cilexetil, [DOPC]/cholesterol (x = 0.15)]/candesartan cilexetil and TCV-116 in d6-DMSO at 27 °C.
| Atoms or groups |
DOPC/TCV-116 (x = 0.10) |
DOPC/TCV-116 (x = 0.20) |
TCV-116 in DMSO |
[DOPC/Cholest. (x = 0.30)]/ TCV-116 (x = 0.20) |
[DOPC/Cholest. (x = 0.15)]/ TCV-116 (x = 0.20) |
|---|---|---|---|---|---|
| Hcil11 | 5.68, 5.62 | 5.66, 5.60 | 5.50 (s) | 5.70, 5.61 | 5.68, 5.59 |
| Hcil7, | 7.18, 7.08, 7.03, 6.93 | 7.17, 7.07, 7.03, 6.93 | 6.78 (m) | 7.17, 7.08, 7.04, 6.93 | 7.17, 7.07, 7.03, 6.93 |
| Hcil13/17, | 6.89 (d) | ||||
| Hcil14/16 | 6.99 (d) | ||||
| Hcil19/28 | 7.50 | 7.49 | 7.46 (dd) | 7.50 | 7.55, 7.50 |
| Hcil20/22 | 7.68, 7.57, 7.55 | 7.66, 7.57, 7.54 | 7.63 (td) | 7.64, 7.56 | 7.55, 7.50 |
| Hcil21 | 7.68, 7.57, 7.55 | 7.66, 7.57, 7.54 | 7.54 (t) | 7.64, 7.56 | 7.55, 7.50 |
| Hcil26 | 7.85, 7.76 | 7.84, 7.75 | 7.73 (d) | 7.93, 7.80 | 7.84, 7.75 |
| Hcil27 | 7.37 | 7.36 | 7.21 (t) | 7.36 | 7.36 |
In Table 4 the chemical shifts observed for TCV-116 in d6-DMSO are reported [30]. The results show that all structural segments of TCV-116 are embedded in the phospholipid bilayers as additional peaks are observed both from the aromatic region and non-aromatic regions (H7, H11).
In Figs. 6D and S2 the 1H NMR spectra of [DOPC/CHOL (x = 0.30)]/TCV-116 (x = 0.20) and [DOPC/CHOL (x = 0.15)]/TCV-116 (x = 0.20) are shown. The proton chemical shifts of the two preparations are shown in Tables 2, 3 and 4.
The spectra of the two preparations present identical peaks as it is expected. The spectrum with increased concentration of cholesterol gives correspondingly more intense peaks. In these spectra, the aromatic regions of TCV-116 as well as H11 are apparent. Cholesterol's peaks attributed to H3a, H7eq, H18, H19, H4 and H5 are also apparent. These results lead to the conclusion that both cholesterol and TCV-116 are incorporated into the DOPC bilayers at the same time as additional peaks attributed to their structures are eminent in the spectra and DOPC bilayers can accommodate both of them.
3.2.2. 13C CP/MAS spectra
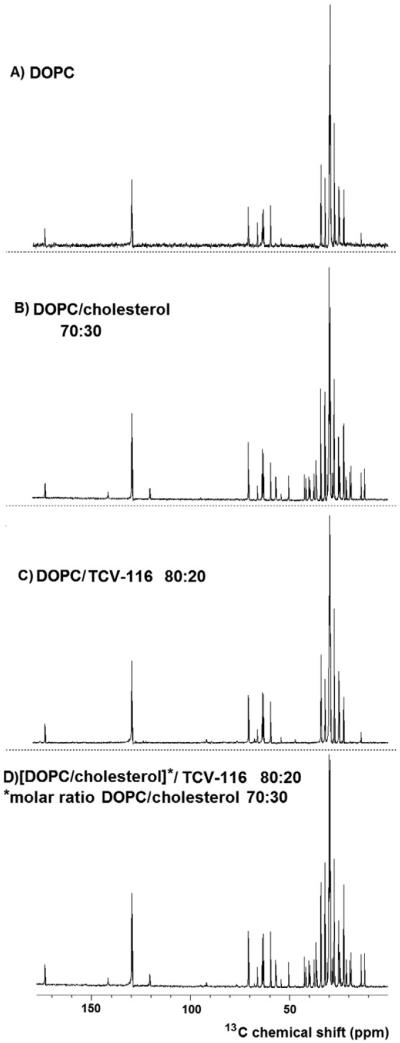
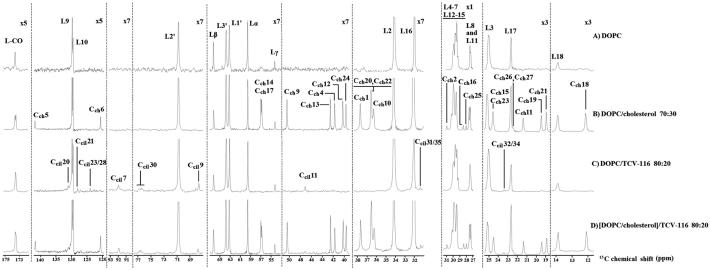
Figs. 7A and 8A show the 13C CP/MAS-NMR of DOPC bilayers in D2O at 27 °C whereas the 13C chemical shifts are shown in Table S1. The obtained values are in agreement with those reported by Zorin et al. [10].
Fig. 7.
13C CP/MAS NMR spectra of (A) DOPC, (B) DOPC/cholesterol (molar ratio 70:30), (C) DOPC/TCV-116 (molar ratio 80:20), and (D) [DOPC/cholesterol]/TCV-116 (molar ratio 80:20) obtained at 27 °C using 850 MHz Bruker spectrometer.
Fig. 8.
Expanded regions of the 13C CP/MAS NMR spectra of (A) DOPC, (B) DOPC/cholesterol (molar ratio 70:30), (C) DOPC/TCV-116 (molar ratio 80:20) (D) [DOPC/cholesterol]/TCV-116 (molar ratio 80:20) obtained at 27 °C using 850 MHz Bruker spectrometer.
In Figs. 7B, 8B, S3 and S4, the 13C CP/MAS-NMR spectra of DOPC bilayers containing 15% and 30% molar ratio cholesterol are shown. In Tables S1 and S2 the chemical shifts of the two preparations are reported. As with 1H NMR spectra the results were in agreement with those reported in the literature [10,40] and less than 2% deviations are observed. Additional information can be obtained by these spectra as almost all peaks attributed to cholesterol are clearly observed.
In Figs. 7C, 8C, S3 and S4 the 13C CP/MAS-NMR spectra of DOPC/TCV-116 (x = 0.10) and DOPC/TCV-116 (x = 0.20) are shown. Both spectra are almost identical and only the low intense carbons are more eminent when the higher concentration of x = 0.20 is used. The observed chemical shifts are shown in Tables S1 and S3. In Table S3 the chemical shifts of TCV-116 data in d6-DMSO are also reported. The utilization of 13C CP/MAS-NMR spectrum allows the confirmation of 1H NMR results.
In Figs. 7D, 8D, S3 and S4, the 13C CP/MAS NMR spectra of [DOPC/CHOL (x = 0.30)]/TCV-116 (x = 0.20) and [DOPC/CHOL (x = 0.15)]/TCV-116 (x = 0.20) are shown. The carbon chemical shifts of the two preparations are shown in Tables S1–S3. The results show that almost all peaks attributed to cholesterol are observed and many peaks originated from the aliphatic and aromatic region of TCV-116. Accommodation of cholesterol in DPPC bilayers with other AT1R antagonists was also reported [7,29,30].
3.3. 2D 1H-1H NOESY NMR experiments
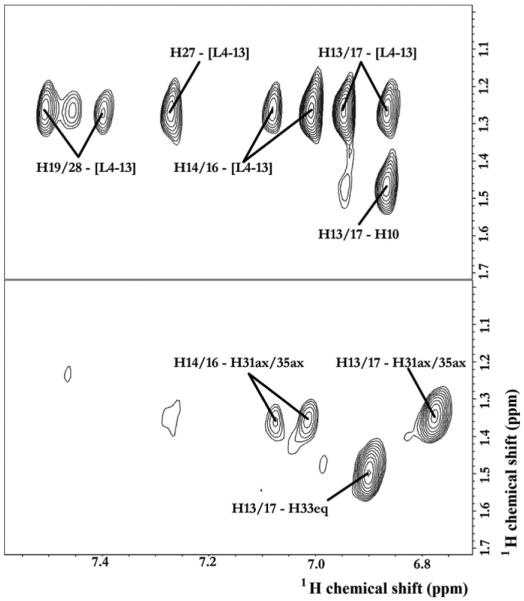
2D 1H-1H NOESY NMR experiments were performed in order to establish within < 5 Å spatial correlations between TCV-116 and dimyristoylphosphatidylcholine (DMPC). Table S4 shows the 1H NMR assignment and Fig. S5 shows the corresponding 1H NMR spectrum. From the spatial correlations observed, of special interest were those between the aromatic ring and the different segments of DMPC (Figs. 9 and S6).
Fig. 9.
Correlations between the aromatic ring and alkyl chain of DMPC bilayers: (A) not deuterated and (B) deuterated using a 2D 1H-1H NOESY NMR experiment obtained at 37 °C at 850 MHz. The mixing time was 150 ms and 200 ms in (A) and (B), respectively.
Since there was an overlapping between the different segments of DMPC and TCV-116, another 2D NOESY experiment was performed using d54-DMPC (Figs. 9 and S7). Thus, with the combination of the two experiments we were able to derive information on the spatial correlations between TCV-116 and DMPC. Fig. 9A shows that all aromatic protons of TCV-116 are in spatial proximity with the L4–13 segment of DMPC in an excellent agreement with solid-state 2H-NMR results. In addition, NOE correlations between the cyclohexane ring with glycerol backbone region and head-group clearly show that cyclohexane ring is pointing toward the head-group region (see Fig S8).
2D NOESY spectra of DMPC or d54-DMPC/TCV-116 bilayers provided additional information. Since the alkyl chain was deuterated, it was possible to observe the intra-molecular interactions between the aromatic ring A (H13–17) with cyclohexane (H33–35). Such interactions are absent in the crystallographic structure of TCV-116 [41]. From the reported conformers of our previous work [30] using MD calculations, only model B can be compatible with this information. In model C, the cyclohexane ring is pointing toward the aromatic ring and such conformation is not observed in the 2D 1H-1H NOESY NMR spectrum. These inter- and intra-molecular interactions, which are observed with the combination of the two experiments, provide a more precise model regarding the topographical position of TCV-116 and its molecular interactions with DMPC segments that complement our previous MD calculations.
4. Conclusions
In this article the comparative dynamic effects of TCV-116 and olmesartan are sought. As it is reported [37,42] TCV-116 has higher lipophilicity with respect to olmesartan. Thus, it is expected that TCV-116 will be embedded deeper in the hydrophobic core and exerts more perturbation on this region compared to olmesartan. Indeed, TCV-116 fluidizes more the lipid bilayers and exerts more pronounced effect when DPPC is deuterated at sites 4 and 7. In contrast, when the DPPC is deuterated at site 2, olmesartan exerts a more significant effect although both molecules perturb the lipid bilayers at this specific region.
It is evident that TCV-116 exerts stronger hydrophobic interactions than olmesartan, although both of them are localized in the mesophase region where they can maximize their amphipathic interactions. Their differences in lipophilicity and specific drug/membrane interactions may account for their distinct pharmacological profile.
In previous publications it was stated that olmesartan and losartan are most probably located at the head-group region and upper segment of the membranes [29,31]. Our obtained results support this view for olmesartan. In addition, it was stated that TCV-116 prefers to locate itself in the interior of DPPC [43]. Both statements are proved true. The present applied techniques confirmed unequivocally the above results and provide complementary information. The presented 2D NOESY experiments allow also to differentiate between reported models B and C obtained through MD experiments and reported elsewhere [30]. Our results favor model B and a more quantitative model is constructed which shows precisely the topography of TCV-116 and olmesartan between two adjacent DMPC phospholipids (Fig. 10).
Additionally, the effects of TCV-116 in the unsaturated DOPC bilayers in the presence and absence of cholesterol are studied in an attempt to complement our previous reported data. From Table 2 it can be inferred that 1H chemical shift differences between the DOPC samples containing either cholesterol or TCV-116 or both are small. This shows that lipid bilayers do not experience drastic changes in terms of their structure when cholesterol is substituted by TCV-116. The fact that drug signals are observed in 13C-CP/MAS spectra of DOPC/cholesterol indicates that they are immobilized by binding to the membrane. If cholesterol was squeezing TCV-116 in the aqueous environment they would not be visible in the CP spectra. The same picture is emerging with 13C chemical shift differences. No significant chemical shift differences (< 0.1 ppm) were observed, which would be expected in the case of significant structural changes or a change in the hydrogen bonding network as we have observed in other drugs such as the cannabinoids [42]. Interestingly, DOPC bilayers showed constantly lower chemical shift values relatively to the rest of the preparations. Cholesterol appears to modify and compete with the properties of AT1R antagonists, but both cholesterol and AT1R antagonists conserve the structural properties of the lipid bilayers in order to easily accommodate them.
Supplementary Material
Acknowledgement
Prof. T. Mavromoustakos and Dr. D. Ntountaniotis acknowledge funding from the Access to Research Infrastructures activity in the 7th Framework Programme of the EC (Project numbers: 261863, Bio-NMR and 228461, EAST-NMR). All solid-state NMR experiments were run at the Goethe University-Frankfurt using BMRZ facilities. This research project has been co-financed by the European Union (European Regional Development Fund—ERDF) and Greek national funds through the Operational Program “THESSALY-MAINLAND GREECE AND EPIRUS-2007–2013” of the National Strategic Reference Framework (NSRF 2007–2013).
Abbreviations
- AT1R
angiotensin II type 1 receptor
- CP/MAS
cross polarization magic angle spinning
- DMPC
dimyristoyl phosphatidyl choline
- DOPC
dioleoyl phosphatidyl choline
- DPPC
dipalmitoyl phosphatidyl choline
- OPLS
Optimized Potential for Liquid Simulations
- PRCG
Polak–Ribiere conjugate gradient
- RAS
renin angiotensin system
- TCV-116
-candesartan cilexetil
Footnotes
Appendix A. Supplementary data
Supplementary data to this article can be found online at http://dx.doi.org/10.1016/j.bbamem.2014.06.003.
References
- [1].Mavromoustakos T, Kolocouris A, Zervou M, Roumelioti P, Matsoukas J, Weisemann R. An effort to understand the molecular basis of hypertension through the study of conformational analysis of Losartan and Sarmesin using a combination of nuclear magnetic resonance spectroscopy and theoretical calculations. J. Med. Chem. 1999;42:1714–1722. doi: 10.1021/jm980499w. [DOI] [PubMed] [Google Scholar]
- [2].De Gasparo M, Catt KJ, Inagami T, Wright JW, Unger T. International union of pharmacology. XXIII. The angiotensin II receptors. Pharmacol. Rev. 2000;52:415–472. [PubMed] [Google Scholar]
- [3].Zoumpoulakis P, Daliani I, Zervou M, Kyrikou I, Siapi E, Lamprinidis G, Mikros E, Mavromoustakos T. Losartan's molecular basis of interaction with membranes and AT 1 receptor. Chem. Phys. Lipids. 2003;125:13–25. doi: 10.1016/s0009-3084(03)00053-7. [DOI] [PubMed] [Google Scholar]
- [4].Lúcio M, Lima JLFC, Reis S. Drug-membrane interactions: significance for medicinal chemistry. Curr. Med. Chem. 2010;17:1795–1809. doi: 10.2174/092986710791111233. [DOI] [PubMed] [Google Scholar]
- [5].Seddon AM, Casey D, Law RV, Gee A, Templer RH, Ces O. Drug interactions with lipid membranes. Chem. Soc. Rev. 2009;38:2509–2519. doi: 10.1039/b813853m. [DOI] [PubMed] [Google Scholar]
- [6].Wagenaar LJ, Voors AA, Buikema H, Van Buiten A, Lübeck RH, Boonstra PW, Van Veldhuisen DJ, Van Gilst WH. Functional antagonism of different angiotensin II type I receptor blockers in human arteries. Cardiovasc. Drugs Ther. 2002;16:311–316. doi: 10.1023/a:1021729909456. [DOI] [PubMed] [Google Scholar]
- [7].Fotakis C, Christodouleas D, Zoumpoulakis P, Kritsi E, Benetis NP, Mavromoustakos T, Reis H, Gili A, Papadopoulos MG, Zervou M. Comparative biophysical studies of sartan class drug molecules losartan and candesartan (CV-11974) with membrane bilayers. J. Phys. Chem. B. 2011;115:6180–6192. doi: 10.1021/jp110371k. [DOI] [PubMed] [Google Scholar]
- [8].Murakami T, Konno H, Fukutsu N, Onodera M, Kawasaki T, Kusu F. Identification of a degradation product in stressed tablets of olmesartan medoxomil by the complementary use of HPLC hyphenated techniques. J. Pharm. Biomed. Anal. 2008;47:553–559. doi: 10.1016/j.jpba.2008.02.021. [DOI] [PubMed] [Google Scholar]
- [9].Mire DE, Silfani TN, Pugsley MK. A review of the structural and functional features of olmesartan medoxomil, an angiotensin receptor blocker. J. Cardiovasc. Pharmacol. 2005;46:585–593. doi: 10.1097/01.fjc.0000180902.78230.fd. [DOI] [PubMed] [Google Scholar]
- [10].Zorin V, Ciesielski F, Griffin DC, Rittig M, Bonev BB. Heteronuclear chemical shift correlation and J-resolved MAS NMR spectroscopy of lipid membranes. Magn. Reson. Chem. 2010;48:925–934. doi: 10.1002/mrc.2690. [DOI] [PubMed] [Google Scholar]
- [11].Mouritsen OG, Zuckermann MJ. What's so special about cholesterol? Lipids. 2004;39:1101–1113. doi: 10.1007/s11745-004-1336-x. [DOI] [PubMed] [Google Scholar]
- [12].Ramamoorthy A, Lee DK, Narasimhaswamy T, Nanga RPR. Cholesterol reduces pardaxin's dynamics—a barrel-stave mechanism of membrane disruption investigated by solid-state NMR. Biochim. Biophys. Acta. 2010;1798:223–227. doi: 10.1016/j.bbamem.2009.08.012. [DOI] [PMC free article] [PubMed] [Google Scholar]
- [13].Epand RF, Ramamoorthy A, Epand RM. Membrane lipid composition and the interaction of pardaxin: the role of cholesterol. Protein Pept. Lett. 2006;13:1–5. [PubMed] [Google Scholar]
- [14].McHenry AJ, Sciacca MFM, Brender JR, Ramamoorthy A. Does cholesterol suppress the antimicrobial peptide induced disruption of lipid raft containing membranes? Biochim. Biophys. Acta. 2012;1818:3019–3024. doi: 10.1016/j.bbamem.2012.07.021. [DOI] [PMC free article] [PubMed] [Google Scholar]
- [15].Brender JR, McHenry AJ, Ramamoorthy A. Does cholesterol play a role in the bacterial selectivity of antimicrobial peptides? Front. Immunol. 2012;3 doi: 10.3389/fimmu.2012.00195. [DOI] [PMC free article] [PubMed] [Google Scholar]
- [16].Santos JS, Lee DK, Ramamoorthy A. Effects of antidepressants on the conformation of phospholipid headgroups studied by solid-state NMR. Magn. Reson. Chem. 2004;42:105–114. doi: 10.1002/mrc.1327. [DOI] [PubMed] [Google Scholar]
- [17].Oliveira TR, Lamy MT, De Paula UM, Guimarães LL, Toledo MS, Takahashi HK, Straus AH, Lindsey CJ, Paiva TB. Structural properties of lipid reconstructs and lipid composition of normotensive and hypertensive rat vascular smooth muscle cell membranes. Braz. J. Med. Biol. Res. 2009;42:844–853. doi: 10.1590/s0100-879x2009005000012. [DOI] [PubMed] [Google Scholar]
- [18].Netticadan TJ, Ashavaid TF, Nair KG. Characterisation of the canine cardiac sarcolemma in experimental myocardial ischemia. Indian J. Clin. Biochem. 1997;12:49–54. doi: 10.1007/BF02867955. [DOI] [PMC free article] [PubMed] [Google Scholar]
- [19].Koynova R, Caffrey M. Phases and phase transitions of the phosphatidylcholines. Biochim. Biophys. Acta. 1998;1376:91–145. doi: 10.1016/s0304-4157(98)00006-9. [DOI] [PubMed] [Google Scholar]
- [20].Tristram-Nagle S. Kinetics of the subtransition in dipalmitoylphosphatidyicholine. Biochemistry. 1987;26:4288–4294. doi: 10.1021/bi00388a016. [DOI] [PubMed] [Google Scholar]
- [21].Rand RP, Chapman D, Larsson K. Tilted hydrocarbon chains of dipalmitoyl lecithin become perpendicular to the bilayer before melting. Biophys. J. 1975;15:1117–1124. doi: 10.1016/S0006-3495(75)85888-7. [DOI] [PMC free article] [PubMed] [Google Scholar]
- [22].McIntosh TJ. Differences in hydrocarbon chain tilt between hydrated phosphatidylethanolamine and phosphatidylcholine bilayers. A molecular packing model. Biophys. J. 1980;29:237–245. doi: 10.1016/S0006-3495(80)85128-9. [DOI] [PMC free article] [PubMed] [Google Scholar]
- [23].Stamatoff J, Feuer B, Guggenheim HJ, Tellez G, Yamane T. Amplitude of rippling in the P beta phase of dipalmitoylphosphatidylcholine bilayers. Biophys. J. 1982;38:217–226. doi: 10.1016/S0006-3495(82)84551-7. [DOI] [PMC free article] [PubMed] [Google Scholar]
- [24].Colthup NB, Daly LH, Wiberley SE. Introduction to infrared and Raman spectroscopy. 3rd Academic Press; Boston: 1990. [Google Scholar]
- [25].Huang CH, Lapides JR, Levin IW. Phase-transition behavior of saturated, symmetric chain phospholipid bilayer dispersions determined by Raman spectroscopy: correlation between spectral and thermodynamic parameters. J. Am. Chem. Soc. 1982;104:5926–5930. [Google Scholar]
- [26].Levin IW, Lewis EN. Fourier transform raman spectroscopy of biological materials. Anal. Chem. 1990;62:1101a–1111a. doi: 10.1021/ac00220a001. [DOI] [PubMed] [Google Scholar]
- [27].Pabst G, Rappolt M, Amenitsch H, Laggner P. Structural information from multilamellar liposomes at full hydration: full q-range fitting with high quality X-ray data. Phys. Rev. E Stat. Phys. Plasmas Fluids. 2000;62:4000–4009. doi: 10.1103/physreve.62.4000. [DOI] [PubMed] [Google Scholar]
- [28].Chiu SW, Jakobsson E, Jay Mashl R, Larry Scott H. Cholesterol-induced modifications in lipid bilayers: a simulation study. Biophys. J. 2002;83:1842–1853. doi: 10.1016/S0006-3495(02)73949-0. [DOI] [PMC free article] [PubMed] [Google Scholar]
- [29].Ntountaniotis D, Mali G, Grdadolnik SG, Maria H, Skaltsounis AL, Potamitis C, Siapi E, Chatzigeorgiou P, Rappolt M, Mavromoustakos T. Thermal, dynamic and structural properties of drug AT 1 antagonist olmesartan in lipid bilayers. Biochim. Biophys. Acta. 2011;1808:2995–3006. doi: 10.1016/j.bbamem.2011.08.001. [DOI] [PubMed] [Google Scholar]
- [30].Fotakis C, Megariotis G, Christodouleas D, Kritsi E, Zoumpoulakis P, Ntountaniotis D, Zervou M, Potamitis C, Hodzic A, Pabst G, Rappolt M, Mali G, Baldus J, Glaubitz C, Papadopoulos MG, Afantitis A, Melagraki G, Mavromoustakos T. Comparative study of the AT1 receptor prodrug antagonist candesartan cilexetil with other sartans on the interactions with membrane bilayers. Biochim. Biophys. Acta. 2012;1818:3107–3120. doi: 10.1016/j.bbamem.2012.08.009. [DOI] [PubMed] [Google Scholar]
- [31].Zervou M, Cournia Z, Potamitis C, Patargias G, Durdagi S, Grdadolnik SG, Mavromoustakos T. Insights into the molecular basis of action of the AT1 antagonist losartan using a combined NMR spectroscopy and computational approach. Biochim. Biophys. Acta. 2014;1838:1031–1046. doi: 10.1016/j.bbamem.2013.12.012. [DOI] [PubMed] [Google Scholar]
- [32].Hodzic A, Zoumpoulakis P, Pabst G, Mavromoustakos T, Rappolt M. Losartan's affinity to fluid bilayers modulates lipid–cholesterol interactions. PCCP. 2012;14:4780–4788. doi: 10.1039/c2cp40134g. [DOI] [PubMed] [Google Scholar]
- [33].Ramamoorthy A, Xu J. 2D 1H/1H RFDR and NOESY NMR experiments on a membrane-bound antimicrobial peptide under magic angle spinning. J. Phys. Chem. B. 2013;117:6693–6700. doi: 10.1021/jp4034003. [DOI] [PubMed] [Google Scholar]
- [34].MacroModel, version 9.9. Schrödinger, LLC; New York, NY: 2012. [Google Scholar]
- [35].Seelig A, Seelig J. Bilayers of dipalmitoyl 3 sn phosphatidylcholine. Conformational differences between the fatty acyl chains. Biochim. Biophys. Acta. 1975;406:1–5. doi: 10.1016/0005-2736(75)90037-1. [DOI] [PubMed] [Google Scholar]
- [36].Yang DP, Mavromoustakos T, Beshah K, Makriyannis A. Amphipathic interactions of cannabinoids with membranes. A comparison between Δ8-THC and its O-methyl analog using differential scanning calorimetry, X-ray diffraction and solid state 2H-NMR. Biochim. Biophys. Acta. 1992;1103:25–36. doi: 10.1016/0005-2736(92)90053-o. [DOI] [PubMed] [Google Scholar]
- [37].Michel MC, Foster C, Brunner HR, Liu L. A systematic comparison of the properties of clinically used angiotensin II type 1 receptor antagonists. Pharmacol. Rev. 2013;65:809–848. doi: 10.1124/pr.112.007278. [DOI] [PubMed] [Google Scholar]
- [38].Seelig A, Seelig J. The dynamic structure of fatty acyl chains in a phospholipid bilayer measured by deuterium magnetic resonance. Biochemistry. 1974;13:4839–4845. doi: 10.1021/bi00720a024. [DOI] [PubMed] [Google Scholar]
- [39].Mavromoustakos T, Yang DP, Makriyannis A. Effects of the anesthetic steroid alphaxalone and its inactive Δ16-analog on the thermotropic properties of membrane bilayers. A model for membrane perturbation. Biomembranes. 1995;1239:257–264. doi: 10.1016/0005-2736(95)00153-t. [DOI] [PubMed] [Google Scholar]
- [40].Muhr P, Likussar W, Schubert-Zsilavecz M. Structure investigation and proton and carbon-13 assignments of digitonin and cholesterol using multidimensional NMR techniques. Magn. Reson. Chem. 1996;34:137–142. [Google Scholar]
- [41].Fernández D, Vega D, Ellena JA. Candesartan cilexetil, an antihypertensive agent containing an extended double ester chain. Acta Crystallogr. Sect. E Struct. Rep. Online. 2005;61:o309–o312. [Google Scholar]
- [42].Tosco P, Rolando B, Fruttero R, Henchoz Y, Martel S, Carrupt PA, Gasco A. Physicochemical profiling of sartans: a detailed study of ionization constants and distribution coefficients. Helv. Chim. Acta. 2008;91:468–482. [Google Scholar]
- [43].Mavromoustakos T, Theodoropoulou E. A combined use of 13C-cross polarization/magic angle spinning, 13C-magic angle spinning and 31P-nuclear magnetic resonance spectroscopy with differential scanning calorimetry to study cannabinoid–membrane interactions. Chem. Phys. Lipids. 1998;92:37–52. [Google Scholar]
Associated Data
This section collects any data citations, data availability statements, or supplementary materials included in this article.


