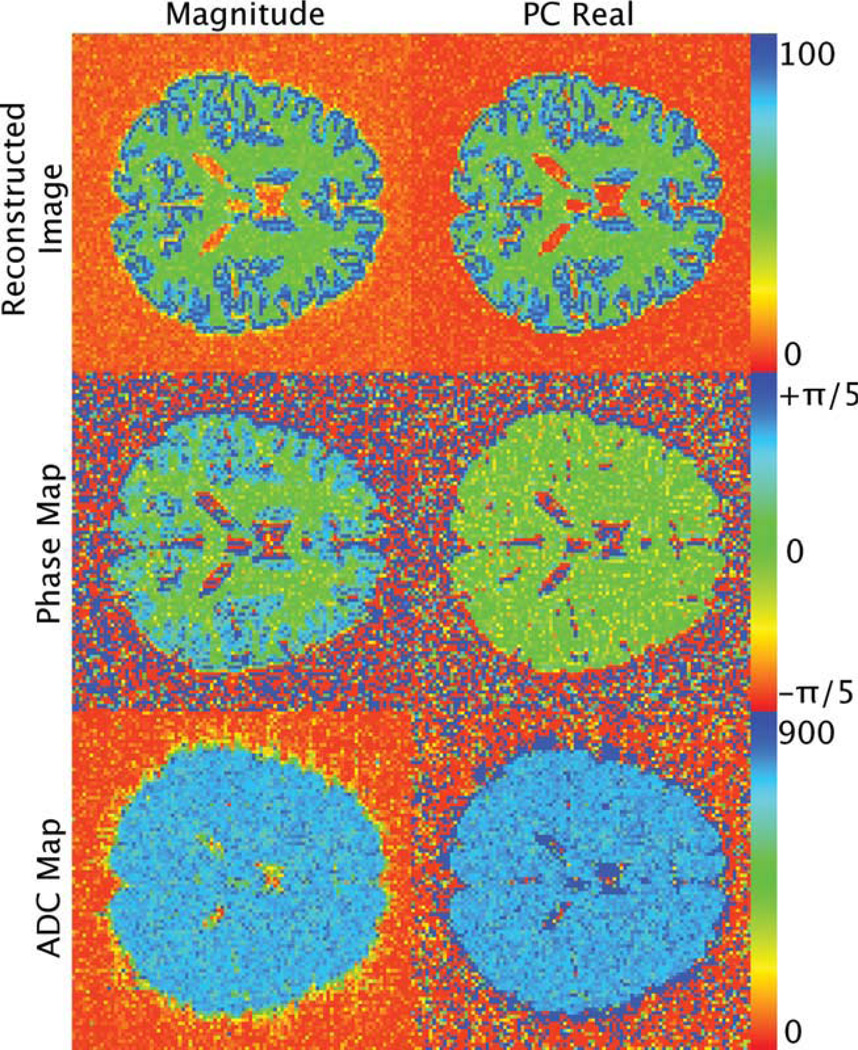
FIG 8.
Reconstructed images, phase maps, and ADC maps for the magnitude and PC real reconstruction techniques obtained from the border effect simulation. The reconstructed images are of the b = 2000 msec/mm2 image and consequentially have an SNR range of 12 to 22. The corresponding calculated ADC maps are also presented. The boundary effects are negligible in the phase maps and ADC map of the PC real data. The reconstructed images were normalized to the maximum value. The phase maps are displayed in units of radians. The ADC maps are displayed in units of micrometers squared per millisecond.

