
Fig. 4.
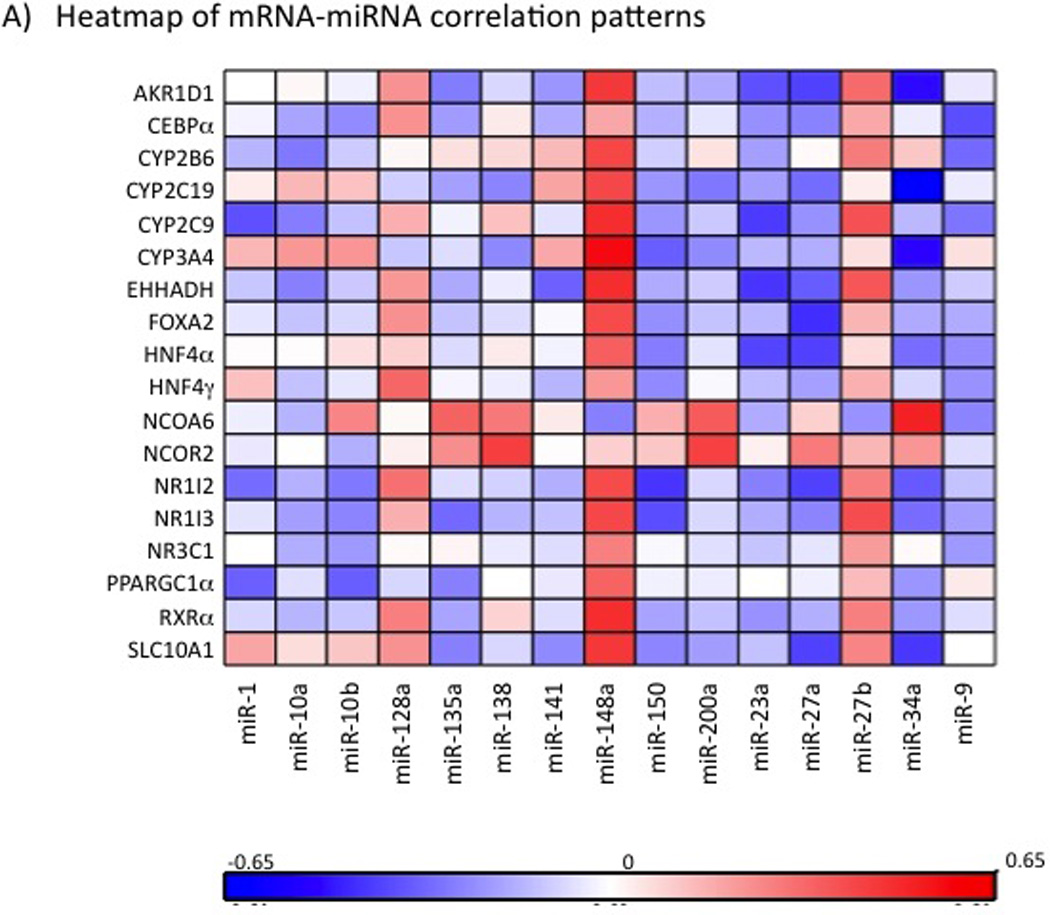
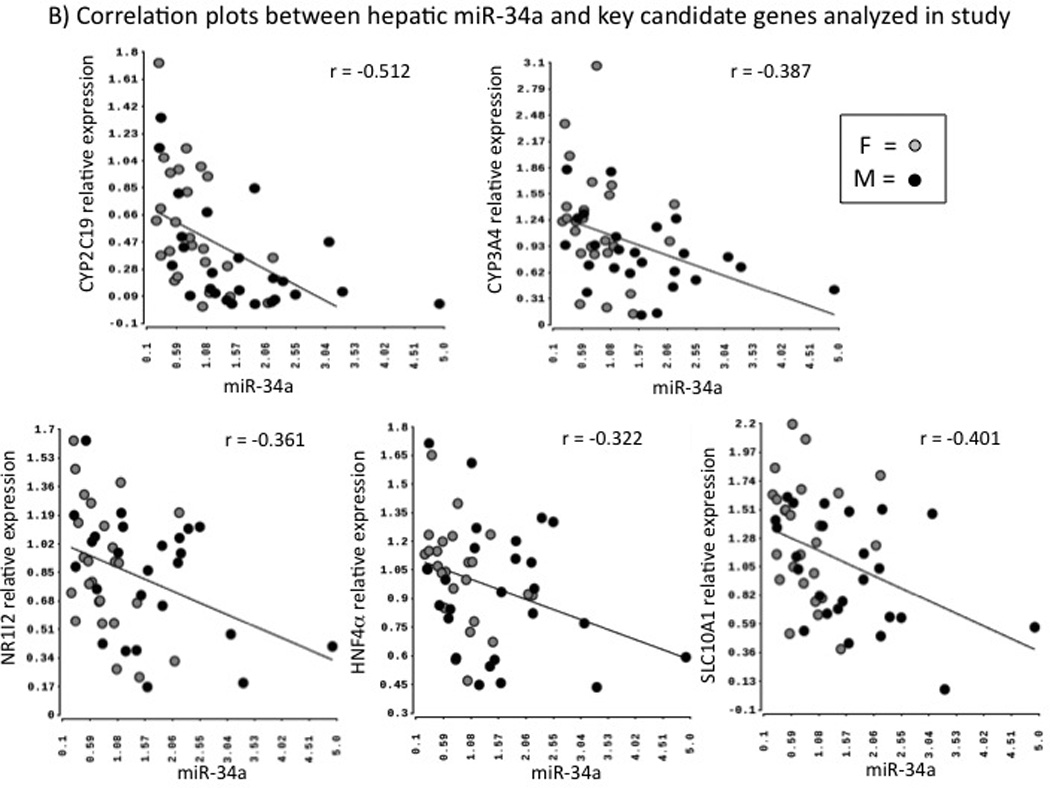
Correlation of miRNAs with mRNAs. 4A) Heatmap of correlation analysis of miRNAs and 21 genes of importance in drug metabolism. Each row represents a mRNA and each column represents a miRNA. Spearman correlation coefficients were calculated to determine relationship of each miRNA with individual mRNAs. Positive correlation coefficients are indicated in red and negative in blue, with higher correlation indicated by higher color intensity as shown by the color scale. Little or no correlations are indicated in white. 4B). Scatter plots of hsa-miR-34a expression with relative mRNA expression of CYP2C19, CYP3A4, SLC10A, NR1I2, and HNF4α respectively. F: Females; M: Males. r = Pearson’s correlation coefficient.