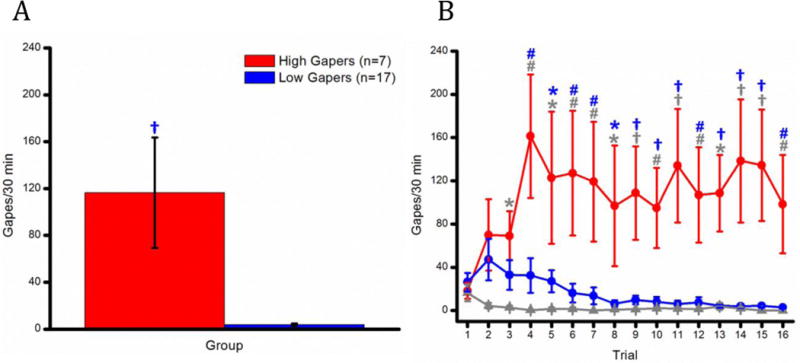
Figure 1.

(A) Mean (+/− SEM) number of gapes/30 min for the High and the Low Gapers averaged across terminal Trials 15 and 16. (B) Mean (+/− SEM) number of gapes/30 min across Trials 1–16 for the High Gapers, the Low Gapers, and the Saline Controls. *, p <0.05; #, p <0.01; †, p <0.001.
