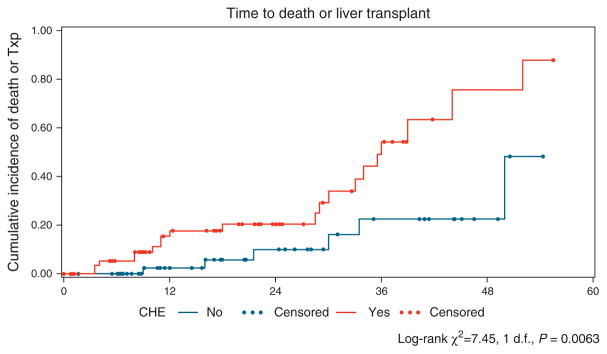
Figure 3.

Time from initial visit to death or transplant (Txp) showed a significant difference between covert hepatic encephalopathy (CHE) and no-CHE groups (P=0.006). The Kaplan–Meier curve for estimated cumulative incidence of the particular outcome in the Y axis and months from initial entry in the X axis. The red lines depict patients with CHE, and blue lines denote patients who were CHE negative at study entry, with each dot signifying censoring due to reaching an outcome. Log-rank statistics were used to compare groups.
