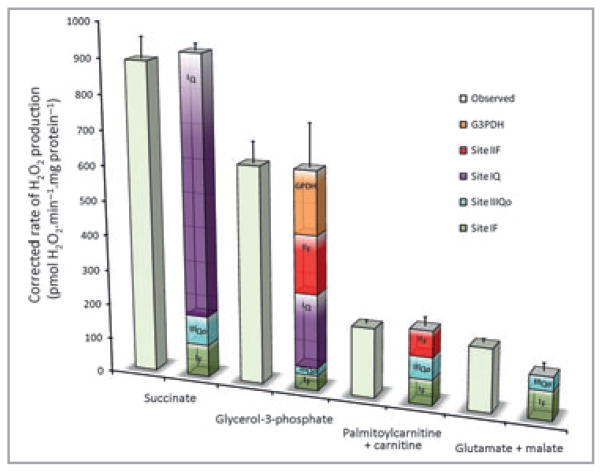
Fig 4.
The contributions of different sites to native rates of hydrogen peroxide production in mitochondria isolated from muscle during oxidation of different substrates in state 4. All rates were either measured in the presence of 1-chloro-2,4-dinitrobenzene to greatly attenuate losses of hydrogen peroxide in the matrix by endogenous glutathione-linked peroxidases,65 or corrected to such measurements using the equations in Quinlan et al.48 and Treberg et al.65 Open bars, observed total rates; coloured stacks of bars, calculated contributions of different sites to the observed rates, as indicated. Values are means ± SEM (n ≥ 3). Data are from unpublished observations and references 47 and 48.

