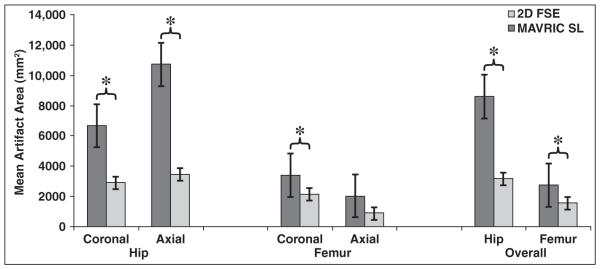
Fig. 2.

Bar graph shows differences in mean artifact areas at hip and femur with 2D fast spin-echo (FSE) and multiacquisition variable-resonance image combination selective (MAVRIC SL) sequences. Measured metallic artifact areas are significantly smaller at MAVRIC SL compared with 2D FSE at level of both hip and femur (p < 0.0001). Asterisks indicate statistically significant differences (p < 0.05).
