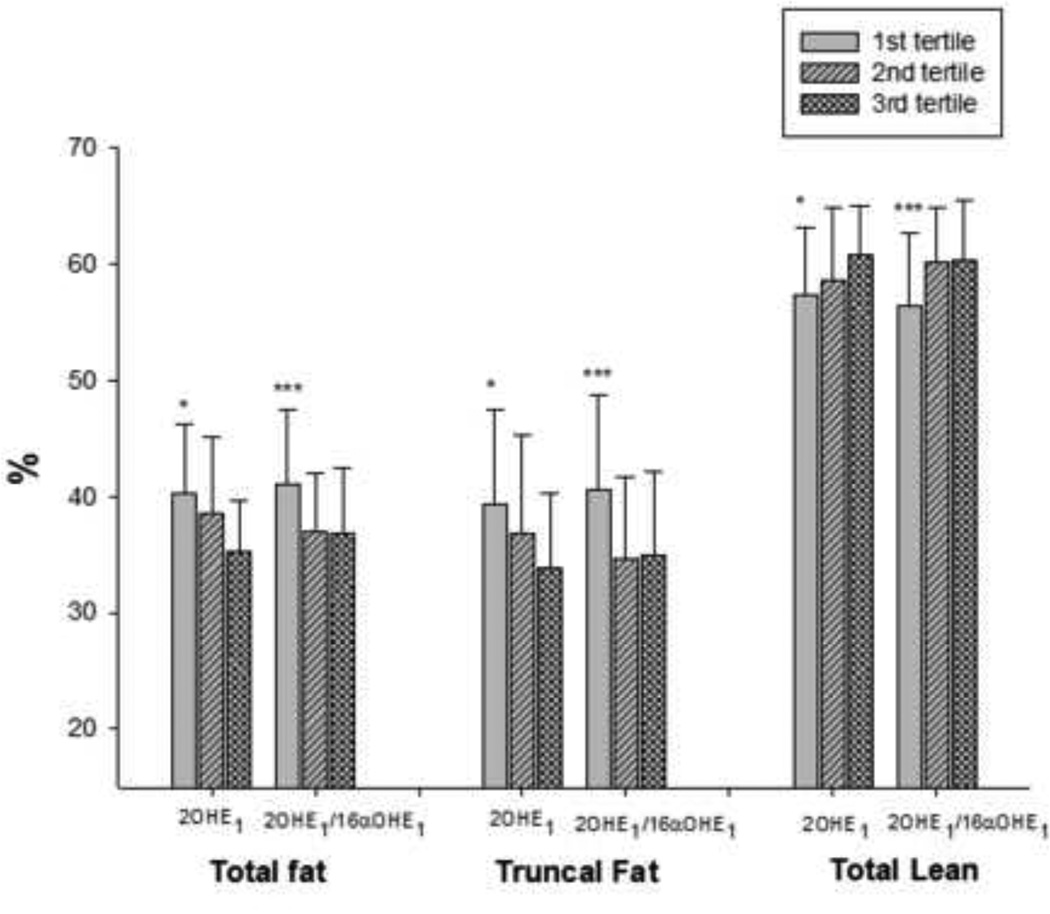
Figure 2.
Parameters of body composition divided according to tertiles of 2OHE1 and 2OHE1/16α-OHE1. Each group represents the averages (mean ± SD) of the % total fat, % truncal fat and % total lean in the different tertiles of 2OHE1 and 2OHE1/16α-OHE1 (from left to right). P values by analysis of variance adjusted for age and menopausal age. *p<0.05:1st vs. 3rd tertile, ***p<0.05 1st vs. 2nd and 3rd tertile by post-hoc analysis

