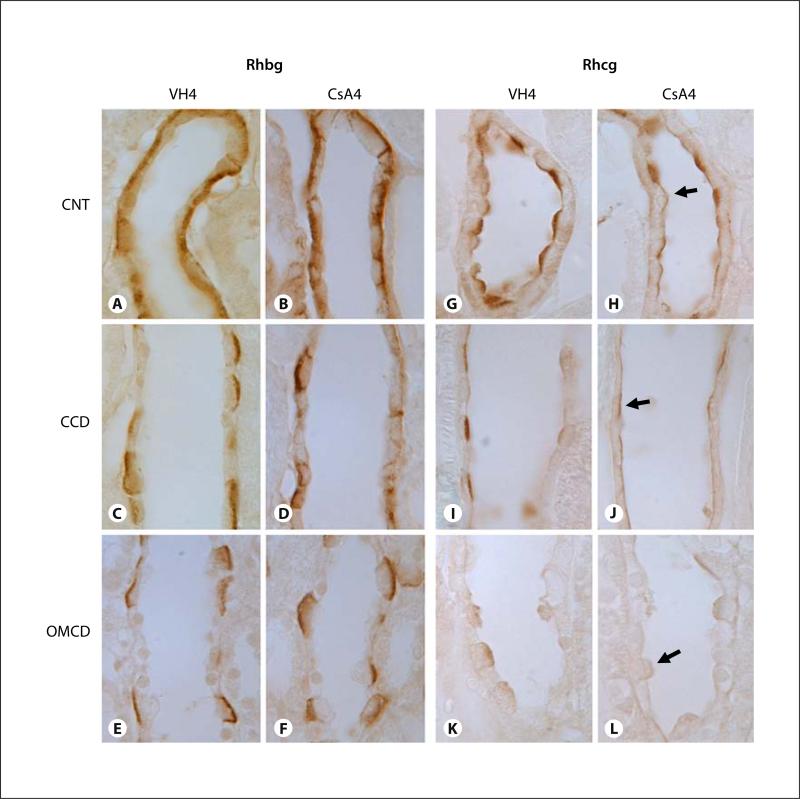
Fig. 3.
Representative micrographs of immunohistochemistry for Rhbg (A–F) and Rhcg (G–L) in the connecting tubule (CNT; A, B, G, H), cortical collecting duct (CCD; C, D, I, J), and outer medullary collecting duct (OMCD; E, F, K, L) of rat kidneys treated with VH (A, C, E, G, I, K) or CsA (B, D, F, H, J, L) for 4 weeks. Predominant immunoreactivity for Rhbg was detected in the basolateral plasma membrane of CNT, CCD, and OMCD. Rhbg expression did not alter in rat kidneys treat with CsA for 4 weeks compared with VH-treated rat kidneys (A–F). Intense immunoreactivity for Rhcg was detected in the apical plasma membrane of CNT, CCD, and OMCD. Rhcg expression was reduced in those regions of the rat kidney treated with CsA for 4 weeks compared with VH-treated rat kidney (G–L). Arrows indicate a weak positive Rhcg reaction from the apical side of the collecting duct. VH4 = Vehicle group treated for 4 weeks; CsA4 = cyclosporine group treated for 4 weeks. Magnification × 1,000.

