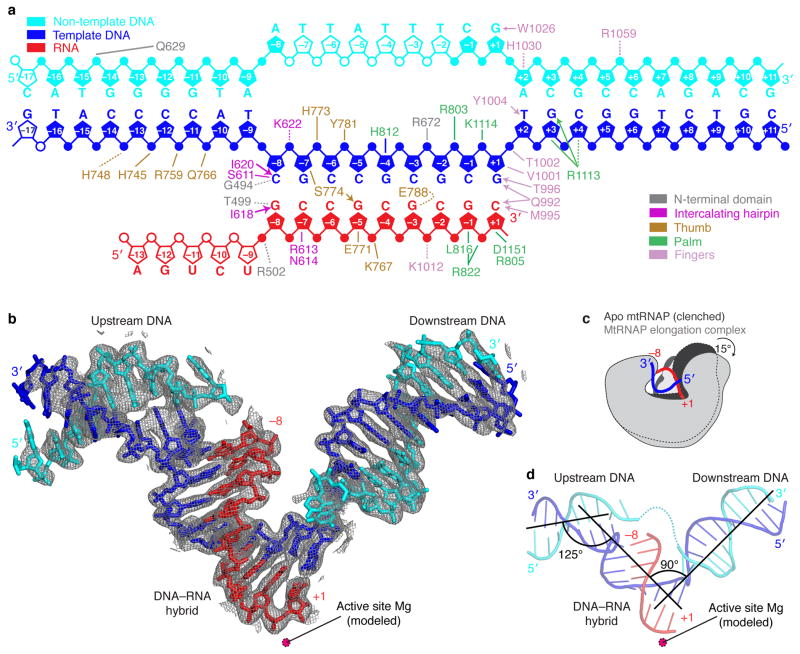
Figure 1. Nucleic acid structure and mtRNAP interactions observed in the crystal structure.
(a) Schematic overview of interactions between mtRNAP and nucleic acids. The nucleic acid scaffold contains template DNA (blue), non-template DNA (cyan) and RNA (red). Unfilled elements were not visible in the electron density map. Interactions with mtRNAP residues are indicated as lines (hydrogen bonds, ≤3.6 Å), dashed lines (electrostatic contacts, 3.6–4.2 Å), or arrows (stacking interactions).
(b) Refined nucleic acid structure with 2Fo-Fc electron density omit map contoured at 1.5σ.
(c) Polymerase opening from the clenched conformation of free mtRNAP (PDB 3SPA5, dark grey) to the elongation complex (light grey). Structures were superimposed based on their NTDs.
(d) Angles between duplex axes of upstream DNA, DNA–RNA hybrid, and downstream DNA.

