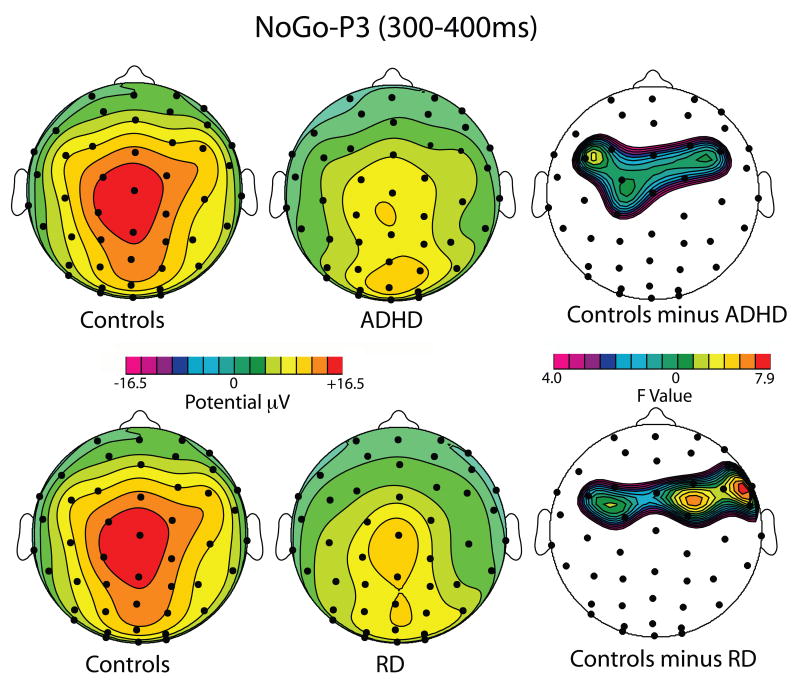
Figure 3.
Topographic maps of the NoGo-P3 to Failed Inhibitions (300-400 ms), illustrating the main NoGo-P3 group effects. Top: Scalp distribution of the NoGo-P3 mean voltage amplitude in μV for the Control Group (Left), the ADHD Group (center) and the RD Group (right). Bottom: Scalp distribution of F-values in the contrast of Controls versus ADHD (left) and Controls versus RD (right). Maps are the result of omnibus F-tests at each scalp sensor, uncorrected for multiple comparisons. Note significant fronto-central NoGO-P3 reductions in both ADHD and RD groups.

