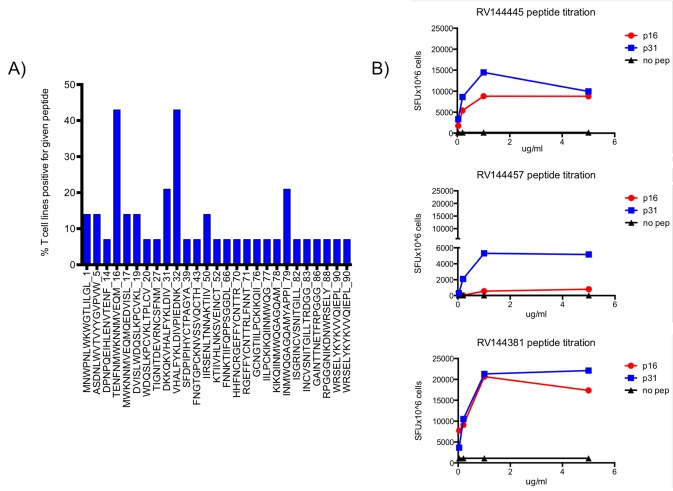
Figure 1. Envelope specific CD4+ T cell responses in RV144 vaccine volunteers.
A) Graphical representation of the percentage of gp120A244 specific CD4+ T cell lines (N = 14) generated from RV144 volunteers that recognize a given peptide. The peptide sequence is showed on the X axis, number at the C-terminus is the sequential peptide number in the pool. B) Titration of the gp120A244 specific CD4+ T cell lines peptide responses. Three T cell lines responding to pep16 and pep31 are shown. Responses were measured in a modified ELISpot assay. Peptide concentration is shown on the X axes.

