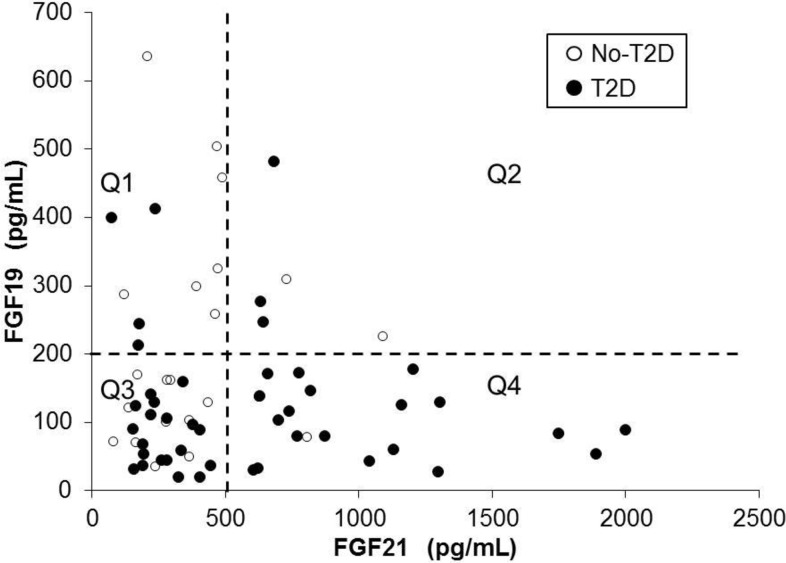
Fig 1. Scatter plot and correlation analysis between FGF19 and FGF21 circulating levels (pg/mL) for diabetic (T2D) and non-diabetic (No-T2D) patients.
The FGF19 and FGF21 data for both T2D and No-T2D data were divided into quartiles (Q1, Q2, Q3, and Q4) by using the serum levels of 500 pg/mL for FGF21 and 200 pg/mL for FGF19 as cut offs. The following four classes of patients according to risk for having diabetes were formed: Q1, lowest risk: FGF19>200 and FGF21<500: n = 4 of 11 (36% with diabetes); Q2, low-to-moderate risk: FGF19>200 and FGF21>500: n = 3 of 5 (60% with diabetes); Q3, moderate-to-high risk: FGF19<200 and FGF21<500: n = 19 of 30 (63% with diabetes); Q4, highest risk: FGF19<200 and FGF21>500: n = 19 of 21 (91% with diabetes). The Chi-square P-value when comparing the four quartiles was significant (0.017).

