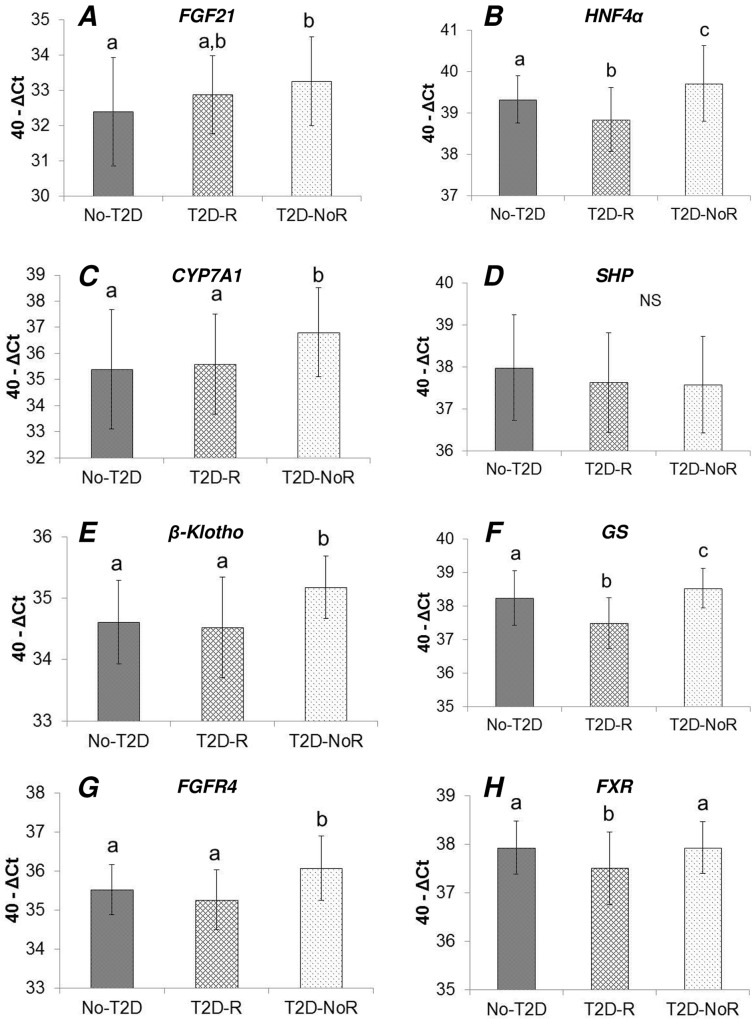
Fig 3. Comparison of hepatic gene expression between non-diabetic (No-T2D) and diabetic patients experiencing diabetes remission (T2D-R) or not experiencing diabetes remission (T2D-NoR) after RYGB surgery.
Gene expression levels (mRNA determined by real time qPCR) for genes modulating the bile acids-FGF19-FGF21 pathway in the liver were compared between the three aforementioned groups. In the cases of FGF21 (A), HNF4α (B), CYP7A1 (C), β-Klotho (E), GS (F), and FGFR4 (G), the T2D-NoR group of patients displayed signifciantly higher expression levels compared to control (i.e., No-T2D) and/or the T2D-R groups. There were no significant differences between the three groups for SHP (D), while, the T2D-R group had signifciantly lower expression levels for HNF4α (B), GS (F), and FXR (H), compared to No-T2D and T2D-NoR. Statistical analysis was performed by using ANOVA followed by Tukey’s test. The different letters (a, b, c) above the bars indicate statistically different groups (significance level at P-value < 0.05). Share of the same letter between groups (bars) indicates lack of statistical significance. NS: not statistically significant.

