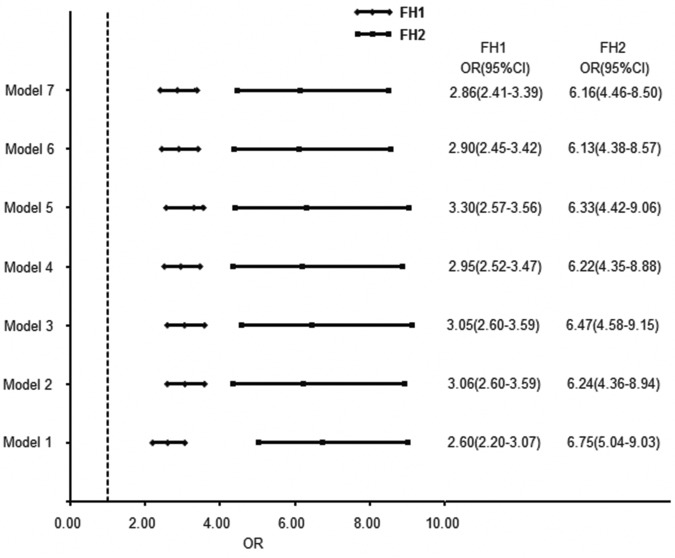
Figure 1. The association between family history risk category and prevalence of diabetes (OR with 95% CI).
The ORs were calculated using logistic regression analysis with FH0 as the reference. Model 1: no adjustment for any variables; Model 2: adjusted by age and gender; Model 3: adjusted by age, gender, and systolic blood pressure; Model 4: adjusted by age, gender, systolic blood pressure, and geographic region (rural or urban); Model 5: adjusted by age, gender, systolic blood pressure, geographic region, and education level; Model 6: adjusted by age, gender, systolic blood pressure, geographic region, education level, and BMI; and Model 7: adjusted by age, gender, systolic blood pressure, geographic region, education level, BMI, and waist circumference. BMI: body mass index; CI: confidence interval; FH0: negative family history of diabetes; OR: odds ratio.

